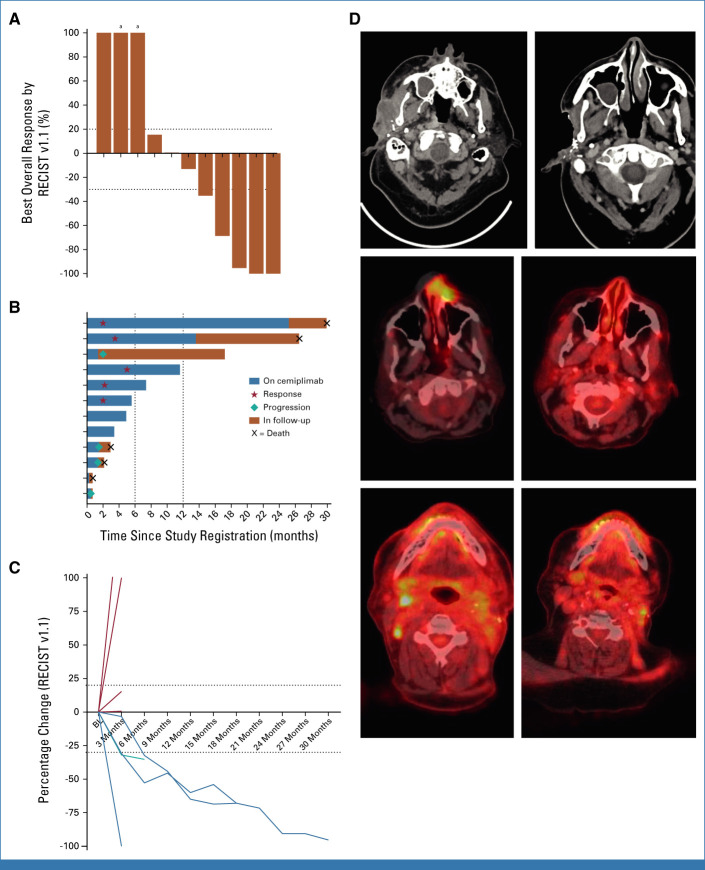
FIG 1.
(A) Waterfall plot depicting best overall response (RECIST v1.1) to cemiplimab treatment. Each column represents an individual patient. (B) Swimmer plot showing time on cemiplimab treatment and follow-up period; each row represents an individual patient. (C) Spider plot showing the percentage change (RECIST v1.1) in tumor measurements over time; each line represents an individual patient. (D) Pretreatment (left) and post-treatment (right) CT images showing an infiltrative right preauricular mass from CSCC that resolved over time. Fused PET and CT scans with false color added showing a left dorsal nose CSCC before (left) and after (right) cemiplimab treatment. Fused PET and CT scans showing right level II neck adenopathy (left) before and after (right) treatment. aDenotes the development of a new lesion at first response assessment. BL, baseline; CSCC, cutaneous squamous cell carcinoma; CT, computed tomography; PET, positron emission tomography.

