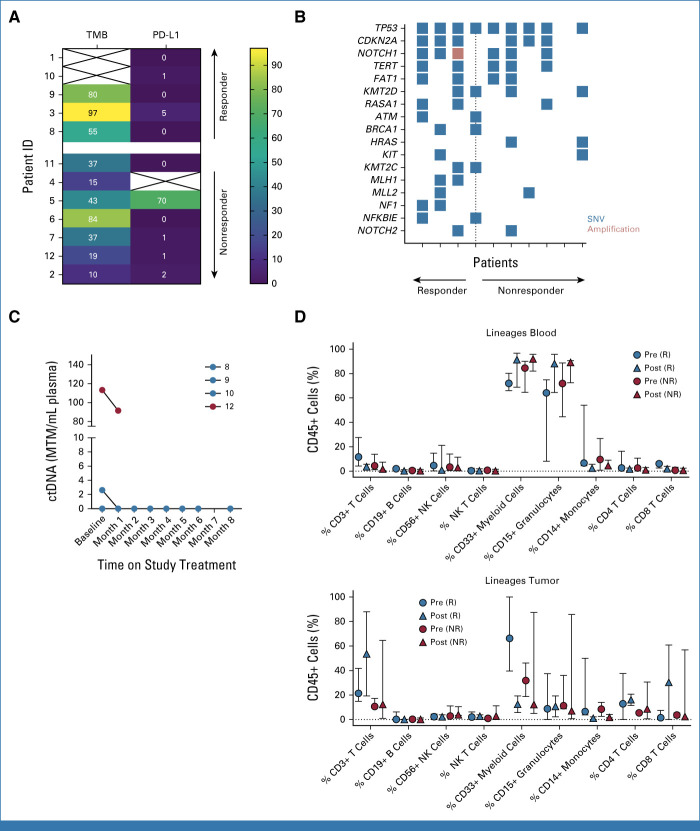
FIG 3.
(A) Tumor mutational burden (mutations per megabase) and PD-L1 TPS plotted for patients with evaluable pretreatment tumor samples arranged by best response to treatment (complete or partial response reflects responders; progressive disease reflects nonresponders). (B) Tumor mutational plot depicting gene alterations among each patient (columns) with evaluable pretreatment tumor material for targeted next-generation sequencing arranged by best response to treatment (only those mutations occurring in at least 20% of samples are depicted). (C) Summary plot of baseline and monthly on-treatment Signatera ctDNA values (MTM/mL) for four participants with available testing results. Patient numerical identifier shown in the legend and color-coded by best overall response (red = responder; blue = unevaluable). (D) In-depth multiparametric immune profiling by flow cytometry on matched or paired blood and tumor specimens before (pre-) and on (post-)treatment separated by response to immunotherapy. ctDNA, circulating tumor DNA; ID, identifier; MTM/ml, mean tumor molecules per mL; NR, nonresponder; R, responder; SNV, singe-nucleotide variant; TPS, tumor proportion score.

