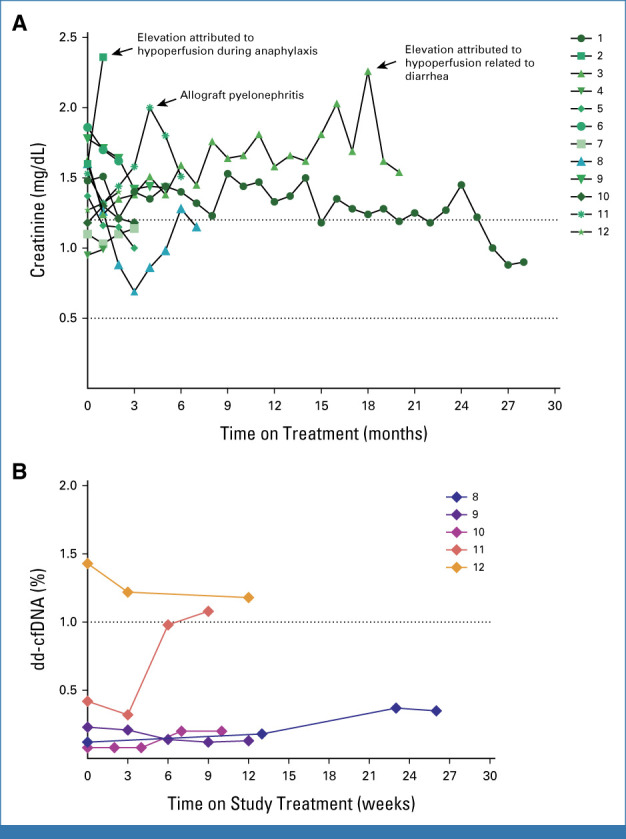
FIG A2.

(A) Graphical plot showing serum creatinine (mg/dL) trend over time from baseline and while on treatment at monthly intervals for all study participants (arranged by participant identifier with annotation for significant events). (B) Prospera dd-cfDNA (%) plotted over time from study baseline (in weeks) for participants with available testing (N = 5; arranged by participant identifier). cfDNA, cell-free DNA; dd, donor-derived.
