
Extended Data Fig. 8 |. Examination of heterogenous microglial populations in Atg7cKO brain.
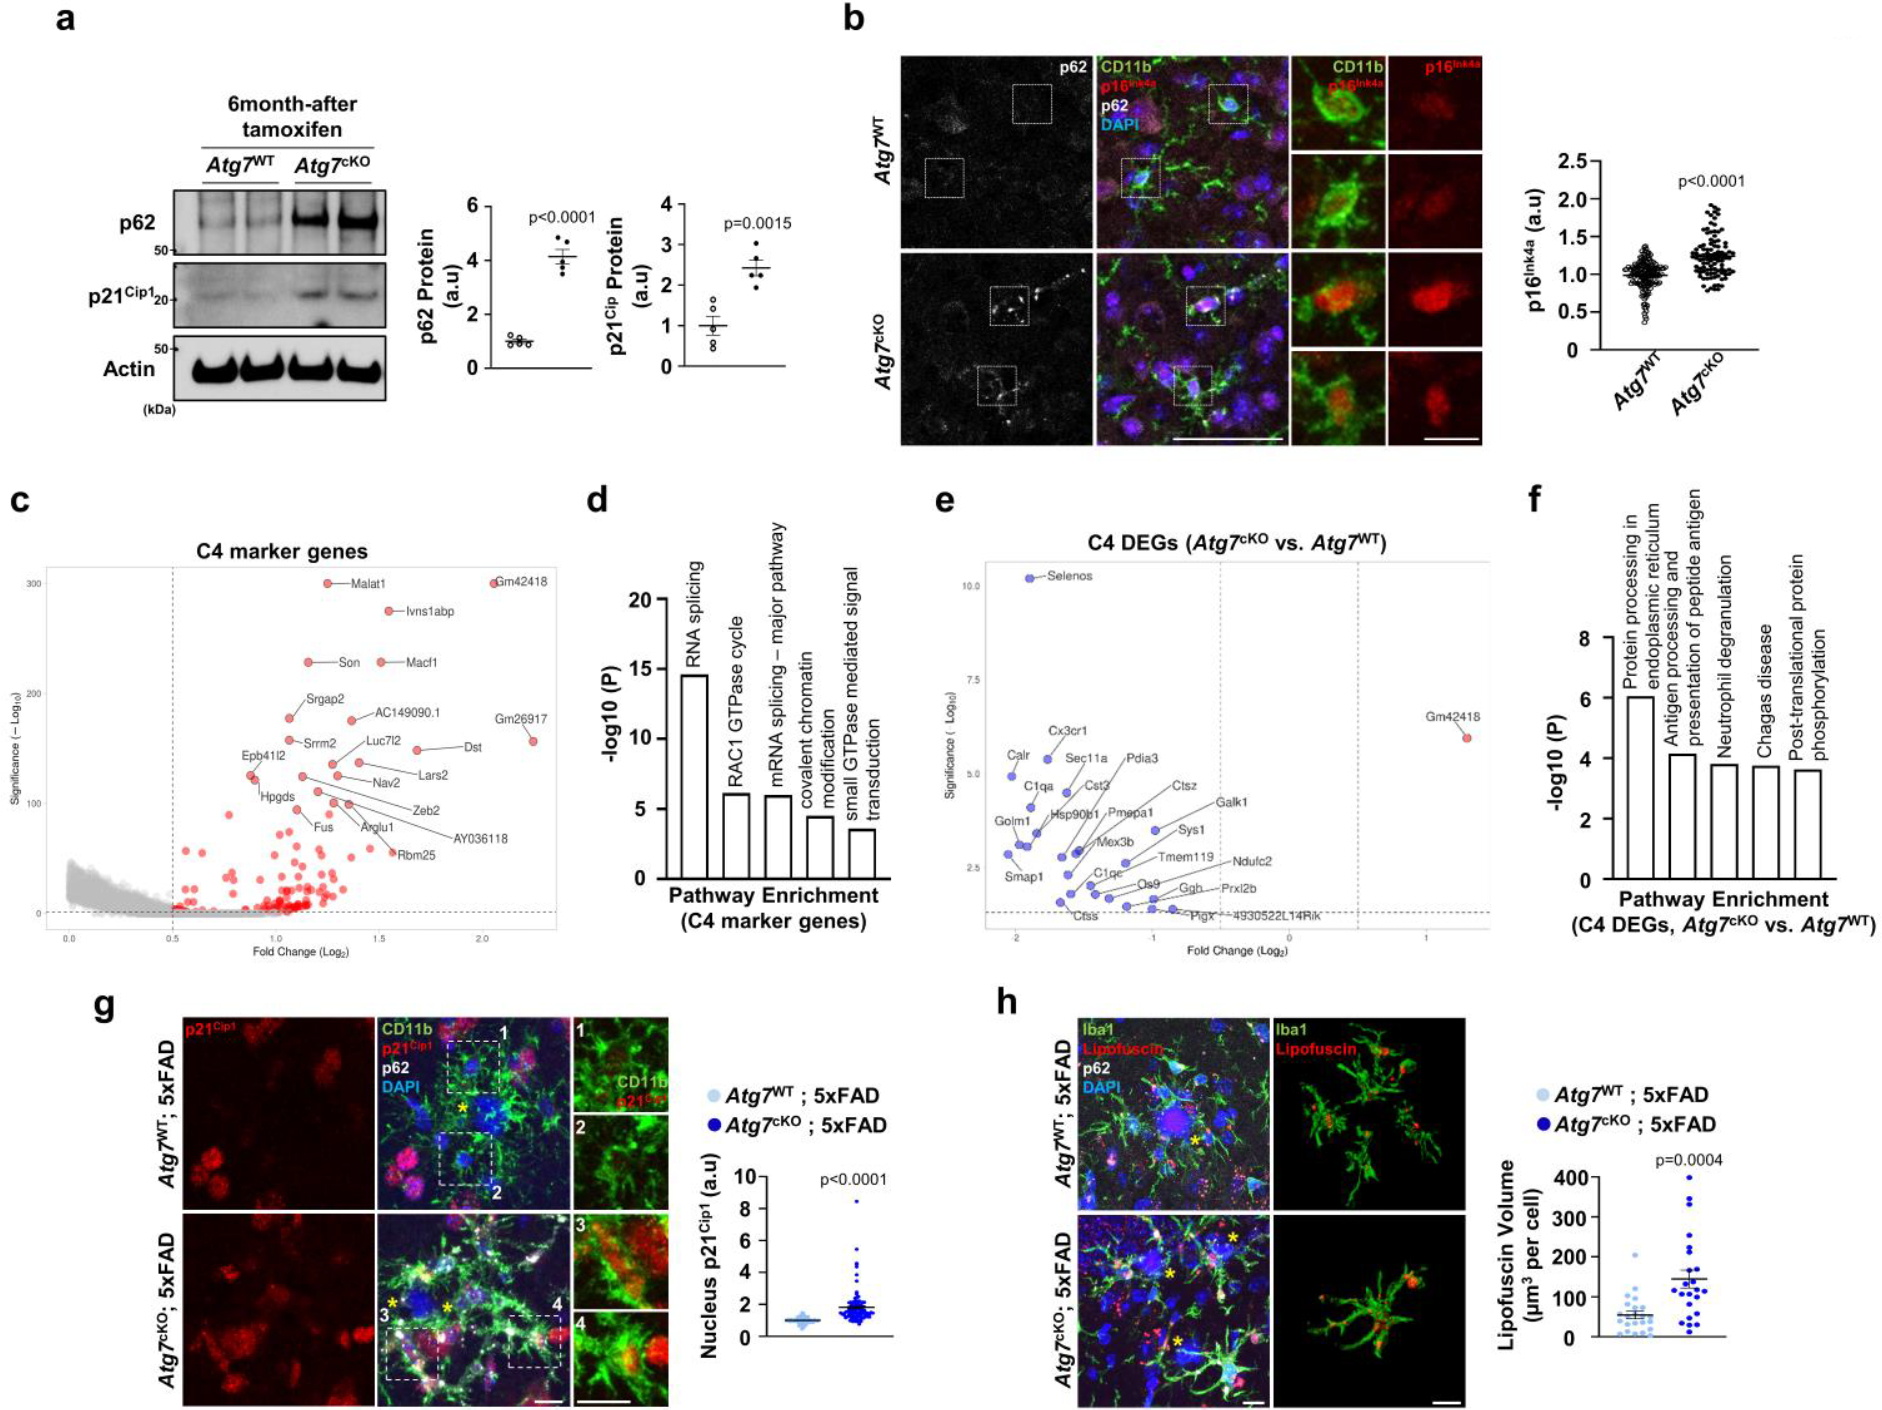
(a) Percoll-enriched fractions of microglia from Atg7cKO (2 male and 3 female mice) and Atg7WT (2 male and 3 female mice) mice brains were processed for Western blot using antibodies against p62 and p21Cip1. Actin was used as a loading control. p < 0.0001 for p62; p = 0.0015 for p21Cip1. (b) The staining intensities of p16Ink4a (149 cells for Atg7WT, 97 cells for Atg7cKO) were determined by Imaris software (see method). 2 male and 2 female mice for each genotype. p < 0.0001. Scale bar, 50 μm; 10 μm for magnified images. (c) Volcano plot of upregulated genes of cluster 4 (C4 vs. other clusters; adjusted p-values < 0.05, Log2FC > 0.5). (d) GO term analysis for upregulated genes of cluster 4. (e) Volcano plot of DEGs of cluster 4 (Atg7cKO vs. Atg7WT; adjusted p-values < 0.05, Log2FC > 0.5 and <−0.5). (f) GO term analysis for downregulated DEGs in Atg7cKO compared to Atg7WT of cluster 4. (g) The staining intensity of p21Cip1 in nuclei of CD11b+ microglia was quantified from Atg7cKO; 5xFAD mice (2 male and 2 female mice, 96 cells) and Atg7WT; 5xFAD mice (2 male and 2 female mice, 111 cells). p < 0.0001. Scale bar, 10 μm. (h) The volumes of Lipofuscin were measured from Atg7cKO; 5xFAD mice (2 male and 1 female mice, 50 cells) and Atg7WT; 5xFAD mice (2 male and 1 female mice, 25cells) were analysed. Yellow asterisks (g, h) indicate DAPI-stained amyloid plaques. p < 0.0001. Scale bar, 10 μm. p-values were calculated by unpaired two-tailed Student’s t-test (a), two-tailed Mann-Whitney U test (b, g, h), or Wilcox rank-sum test (c, e). p-values (d, f) were provided by Metascape (default setting, see method). All values are reported as mean ± SEM. Source numerical data and unprocessed blots are available in source data.