
Fig. 2 |. Examination of neuropathology and microglia associated with amyloid plaques in AD mice lacking microglial autophagy.
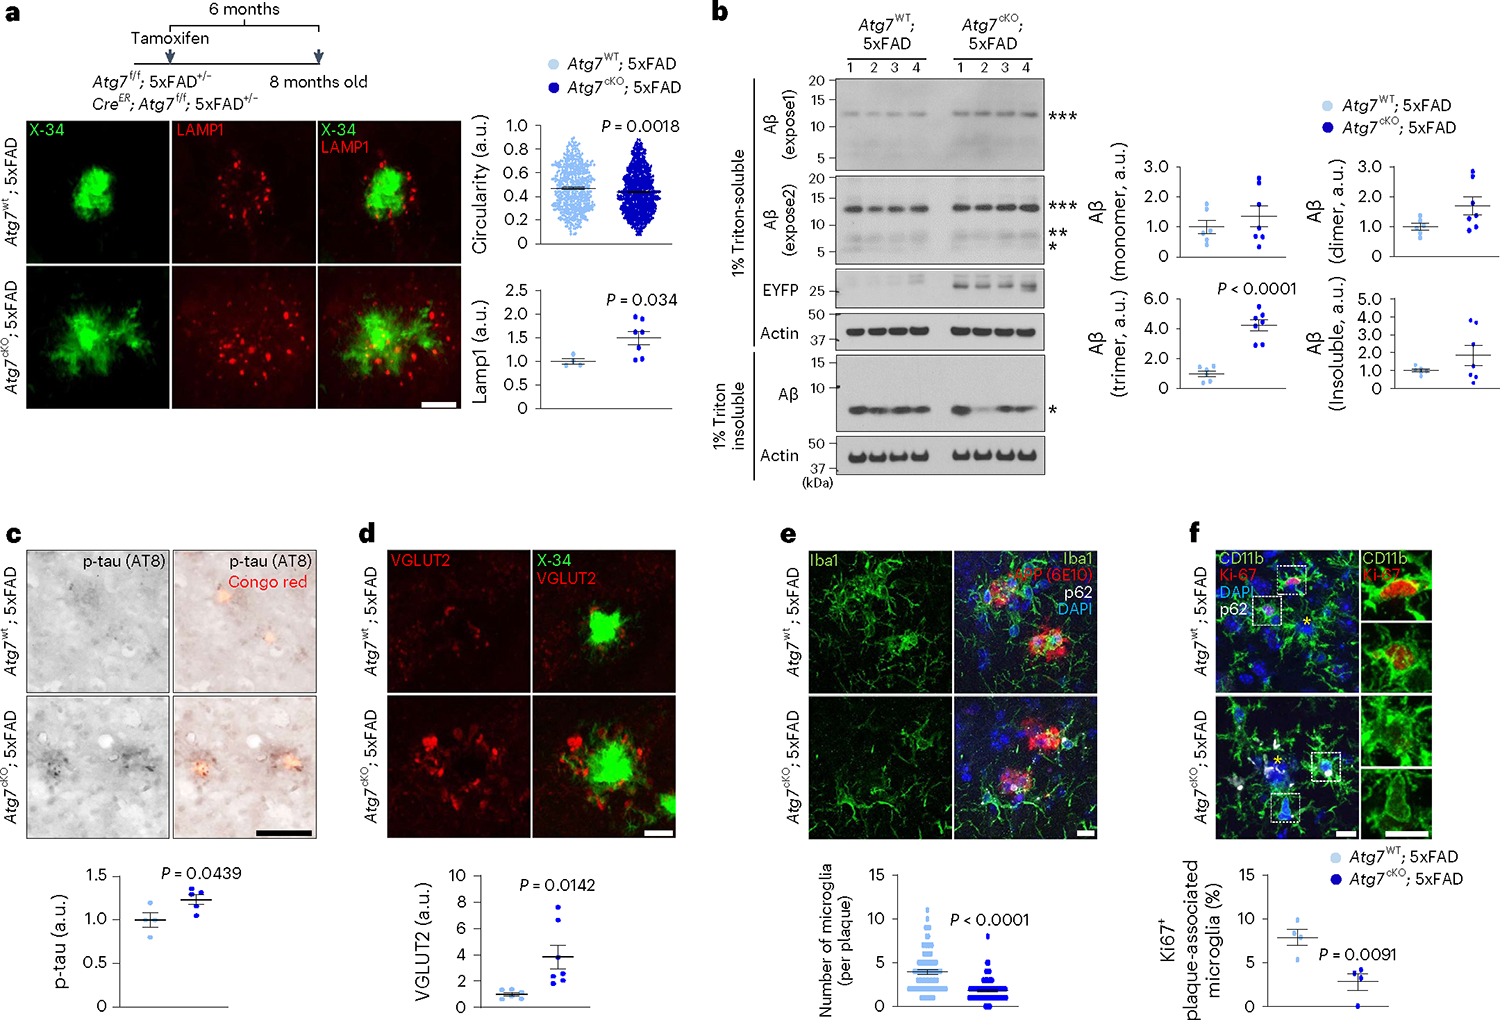
a, The circularities of X-34+ amyloid plaques and the number of Lamp1+ dystrophic neurites around X-34+ amyloid plaques were quantified from Atg7cKO; 5xFAD (7 male mice, 763 plaques) and Atg7WT; 5xFAD (4 male mice, 489 plaques). P = 0.0018 for the circularities; P = 0.034 for Lamp1+ structures. Scale bar, 10 μm. b, Brains from Atg7cKO; 5xFAD (seven male mice) and Atg7WT; 5xFAD mice (six male mice) were homogenized and fractionated into 1% Triton X-100 soluble and insoluble fractions. Levels of Aβ were examined through western blot. EYFP indicates the presence of Cx3crCreER in the mice that co-express EYFP and CreER. P < 0.0001 for Aβ trimer. c, The number of p-tau+ (AT8 clone) structures around Congo Red+ amyloid plaques were measured in Atg7cKO; 5xFAD (five male mice) and Atg7WT; 5xFAD (four male mice) mice. P = 0.0439. Scale bar, 10 μm. d, The areas of enlarged VGLUT2+ structures around X-34+ amyloid plaques were measured in Atg7cKO; 5xFAD (seven male mice) and Atg7WT; 5xFAD (six male mice) mice. P = 0.0142. Scale bar, 10 μm. e, The number of Iba-1+ microglia was counted around amyloid plaques (within 15 μm radius) stained with anti-APP antibody (6E10) from Atg7cKO; 5xFAD mice (4 male mice, 118 plaques) and Atg7WT; 5xFAD mice (7 male mice, 87 plaques). Accumulated p62 puncta indicate autophagy deficiency. P < 0.0001. Scale bar, 10 μm. f, The number of CD11b+ microglia positive with Ki67, a marker of proliferation, was counted around amyloid plaques from Atg7cKO; 5xFAD (two male and two female mice) and Atg7WT; 5xFAD mice (two male and two female mice). Yellow asterisks indicate DAPI-stained amyloid plaques. P = 0.0091. Scale bar, 10 μm. P values were calculated by unpaired two-tailed Student’s t-test (lower part of a–d and f) or two-tailed Mann–Whitney U test (upper parts of a and e). All values are reported as mean ± s.e.m. Source numerical data and unprocessed blots are available in source data.