
Fig. 3 |. Molecular profiling of microglia from Atg7cKO mice.
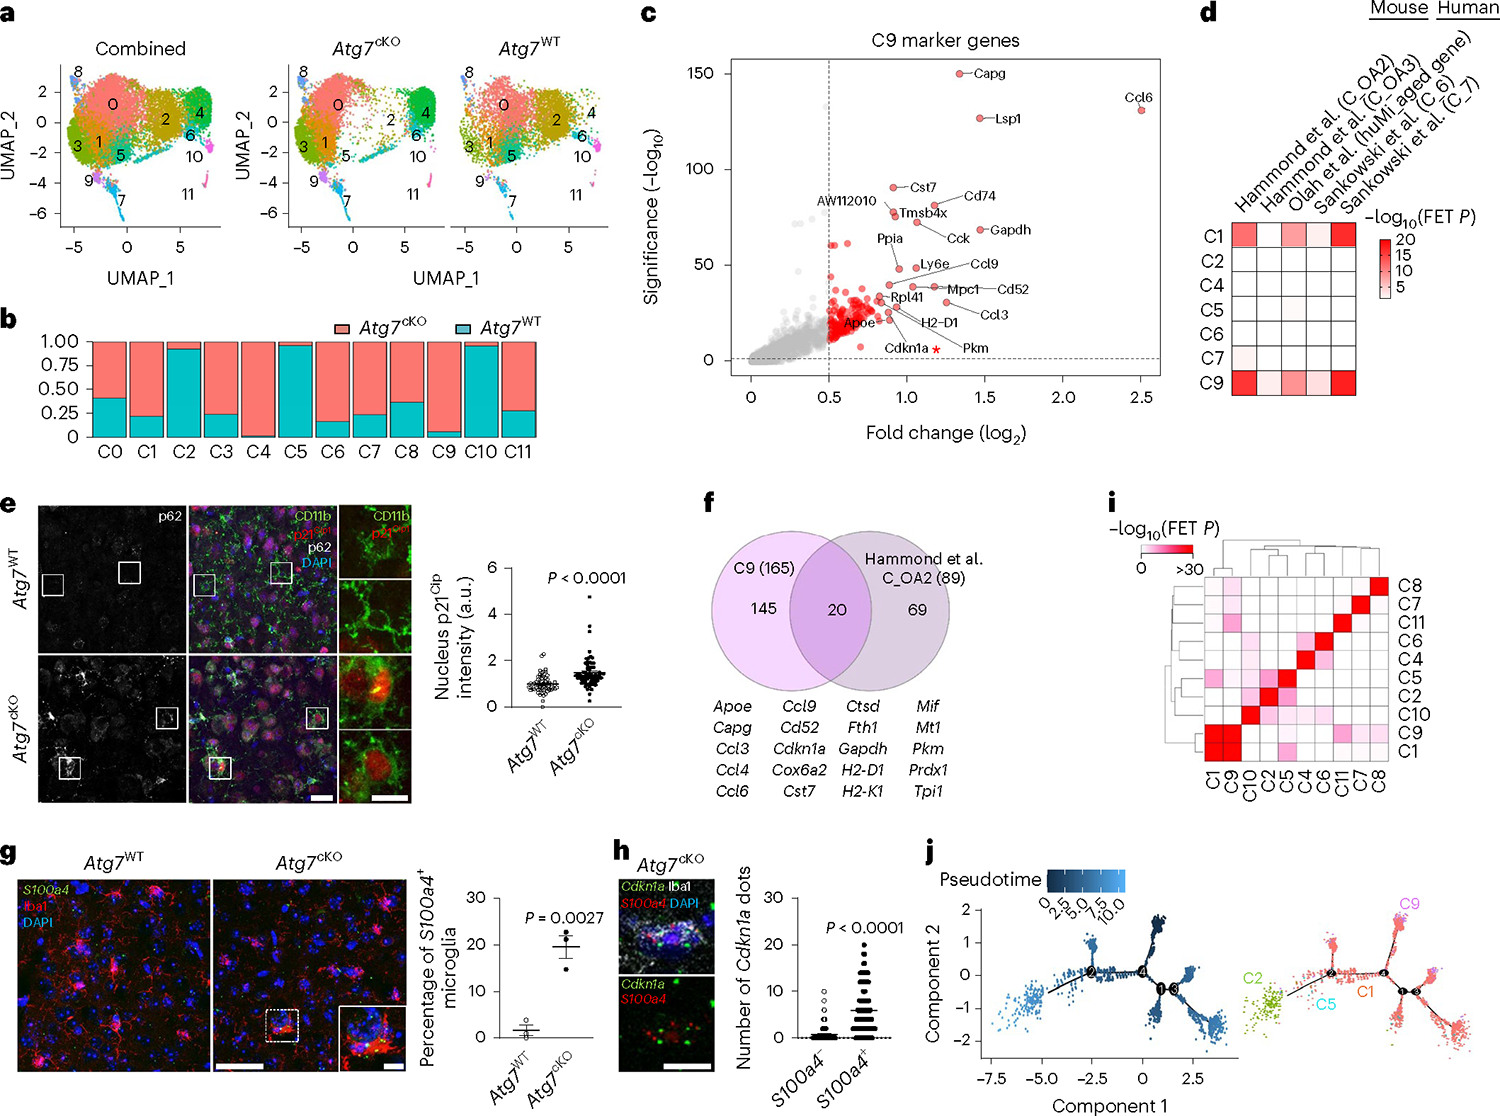
a, UMAP plots of the cells combining Atg7cKO cells and Atg7WT cells (combined, left), Atg7cKO cells (middle) and Atg7WT cells (right). b, Distribution of Atg7cKO cells and Atg7WT cells in each cluster. c, Volcano plot of upregulated genes of cluster 9 (C9 versus other clusters; adjusted P values <0.05, log2FC >0.5). d, Heat map for enrichment test between upregulated DEGs (adjusted P values <0.05, log2FC >0.5) in microglial clusters and previously reported dataset. e, The intensity of p21Cip1 in the nucleus of CD11b+ microglia from Atg7cKO or Atg7WT brains (two male and one female mice, 65 cells for each genotype) was determined by Imaris software (Methods). P < 0.0001. Scale bar, 20 μm (left) and 10 μm (right). f, Venn diagram of the commonly upregulated genes between cluster 9 (adjusted P values <0.05, log2FC >0.5) and OA2 cluster. g, S100a4+ Iba-1+ microglia were examined through RNA scope in situ hybridization assay combined with immunostaining in Atg7WT and Atg7cKO brain (two males and one female mice). P = 0.0027. Scale bar, 50 μm and 10 μm (magnified image). h, The number of Cdkn1a+ dots was counted in S100a4+ or S100a4− microglia in Atg7cKO brain (two males and one female mice). P < 0.0001. Scale bar, 10 μm. i, Comparison among upregulated marker genes (adjusted P values <0.05, log2FC >0.5) of each cluster. j, UMAP for trajectory analysis coloured by pseudotime (left) and subclusters (cluster 1, 2, 5 and 9). P values were calculated by unpaired two-tailed Student’s t-test (g), two-tailed Mann–Whitney U test (e and h), Wilcox rank-sum test (c and f) or one-sided Fisher’s exact test (FET; d and i). Values are reported as mean ± s.e.m. Source numerical data are available in source data.