
Fig. 4 |. Characterization of cellular senescence in Atg7-deficient microglia in vivo.
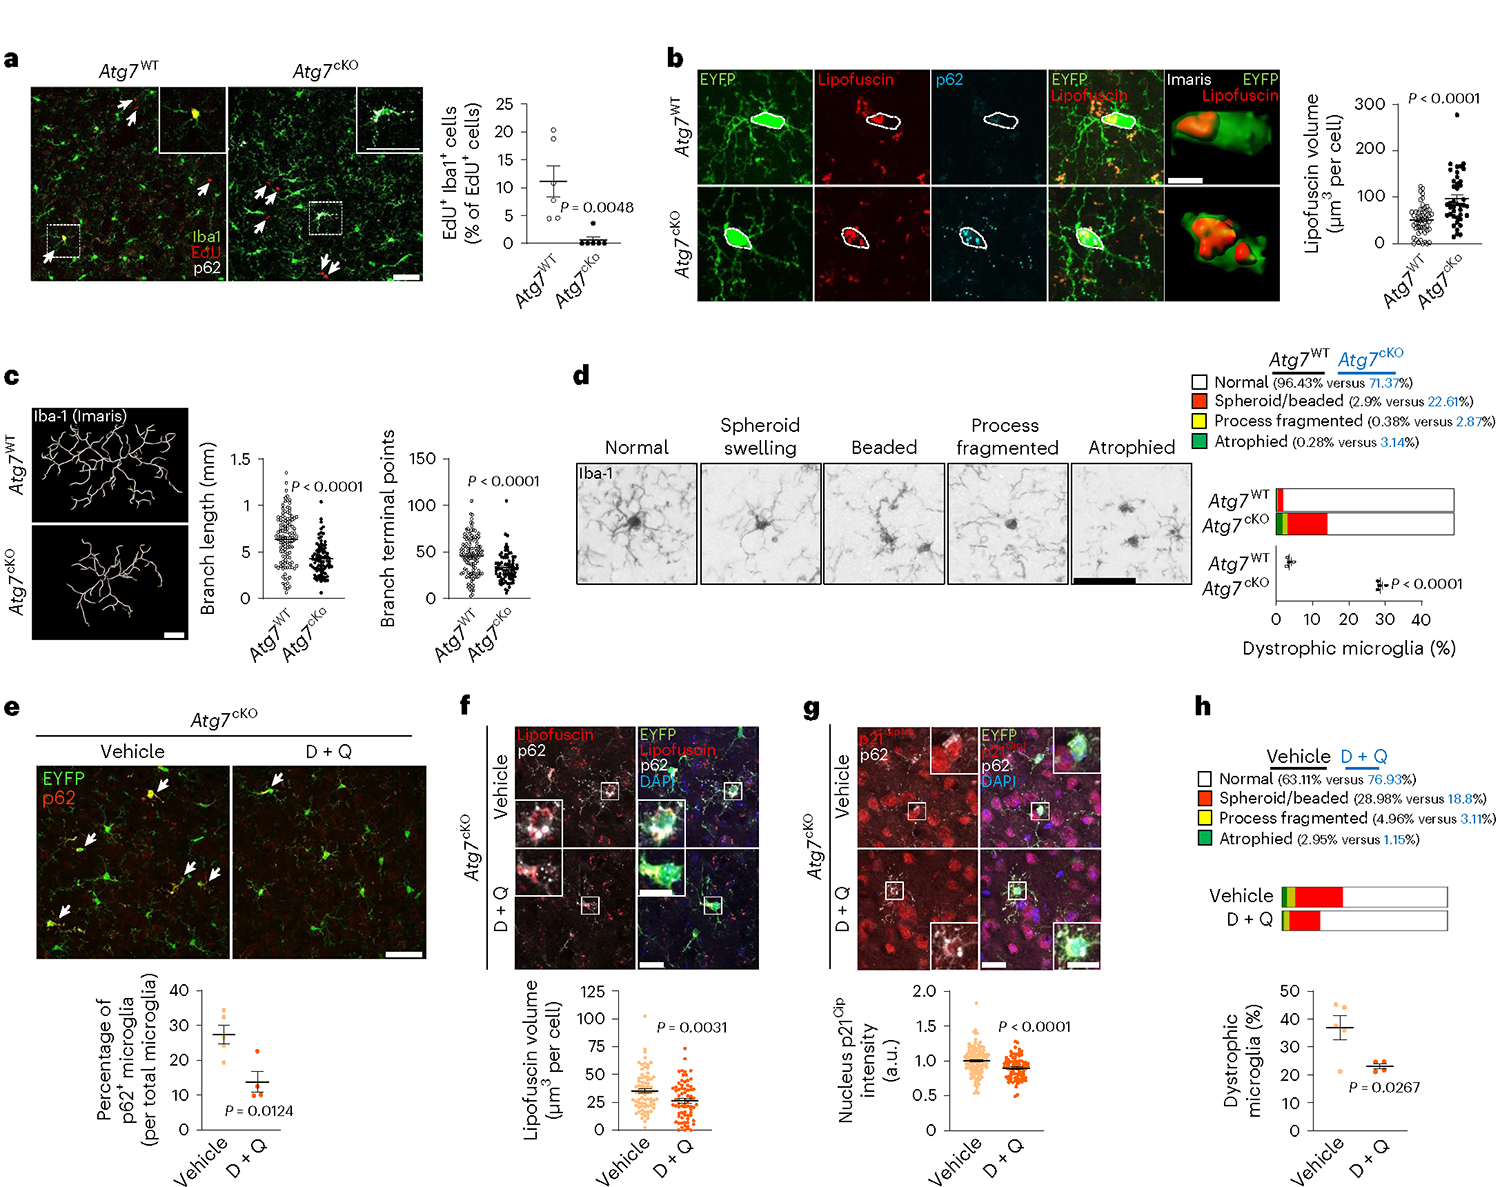
a, EdU assay in Atg7cKO and Atg7WT (five male and two female mice per genotype) mice was performed at 6 months post tamoxifen injection (Methods). Arrows indicate EdU+ cells. P = 0.0048. Scale bar, 50 μm. b, The volumes of Lipofuscin in EYFP+ microglia (CreER mice constitutively express Eyfp under Cx3cr1 promoter) were determined by ‘surface’ plug-in in Imaris software (Methods) from Atg7cKO (2 male and 2 female mice, 41 cells) and Atg7WT (2 male and 2 female mice, 54 cells) brains. P < 0.0001. Scale bar, 20 μm; 5 μm for a magnified image. c, Branch lengths and terminal points numbers of Iba-1+ microglia from Atg7cKO (2 male and 2 female mice, 82 cells) and Atg7WT (2 male and 2 female mice, 120 cells) brains were measured by ‘filament’ plug-in in Imaris software. P < 0.0001. Scale bar, 20 μm. d, Iba-1+ microglia with dystrophic morphologies were counted from Atg7cKO and Atg7WT (four female mice for each genotype) brains. P < 0.0001. Scale bar, 20 μm. e, Following D + Q (two male and two female mice) or vehicle treatment (two male and three female mice) to Atg7cKO mice for 9 days, the number of EYFP+ microglia with p62 accumulation (arrows), indicative of autophagy deficiency, was counted. P = 0.0124. Scale bar, 50 μm. f, After D + Q (72 cells) or vehicle (75 cells), the volumes of Lipofuscin in EYFP+ microglia were measured by ‘surface’ plug-in in Imaris software number. P = 0.0031. Scale bar, 20 μm; 10 μm for magnified images. g, After D + Q (83 cells) or vehicle (123 cells), the staining intensities of nucleus p21Cip1 in EYFP+ microglia were determined by Imaris software (Methods). P < 0.0001. Scale bar, 20 μm; 10 μm for magnified images. h, Iba-1+ microglia with dystrophic morphologies were counted from Atg7cKO mice after treating with either D + Q or vehicle. P = 0.0267. P values were calculated by unpaired two-tailed Student’s t-test (a, d, e and h) or two-tailed Mann–Whitney U test (b, c, f and g). All values are reported as mean ± s.e.m. Source numerical data are available in source data.