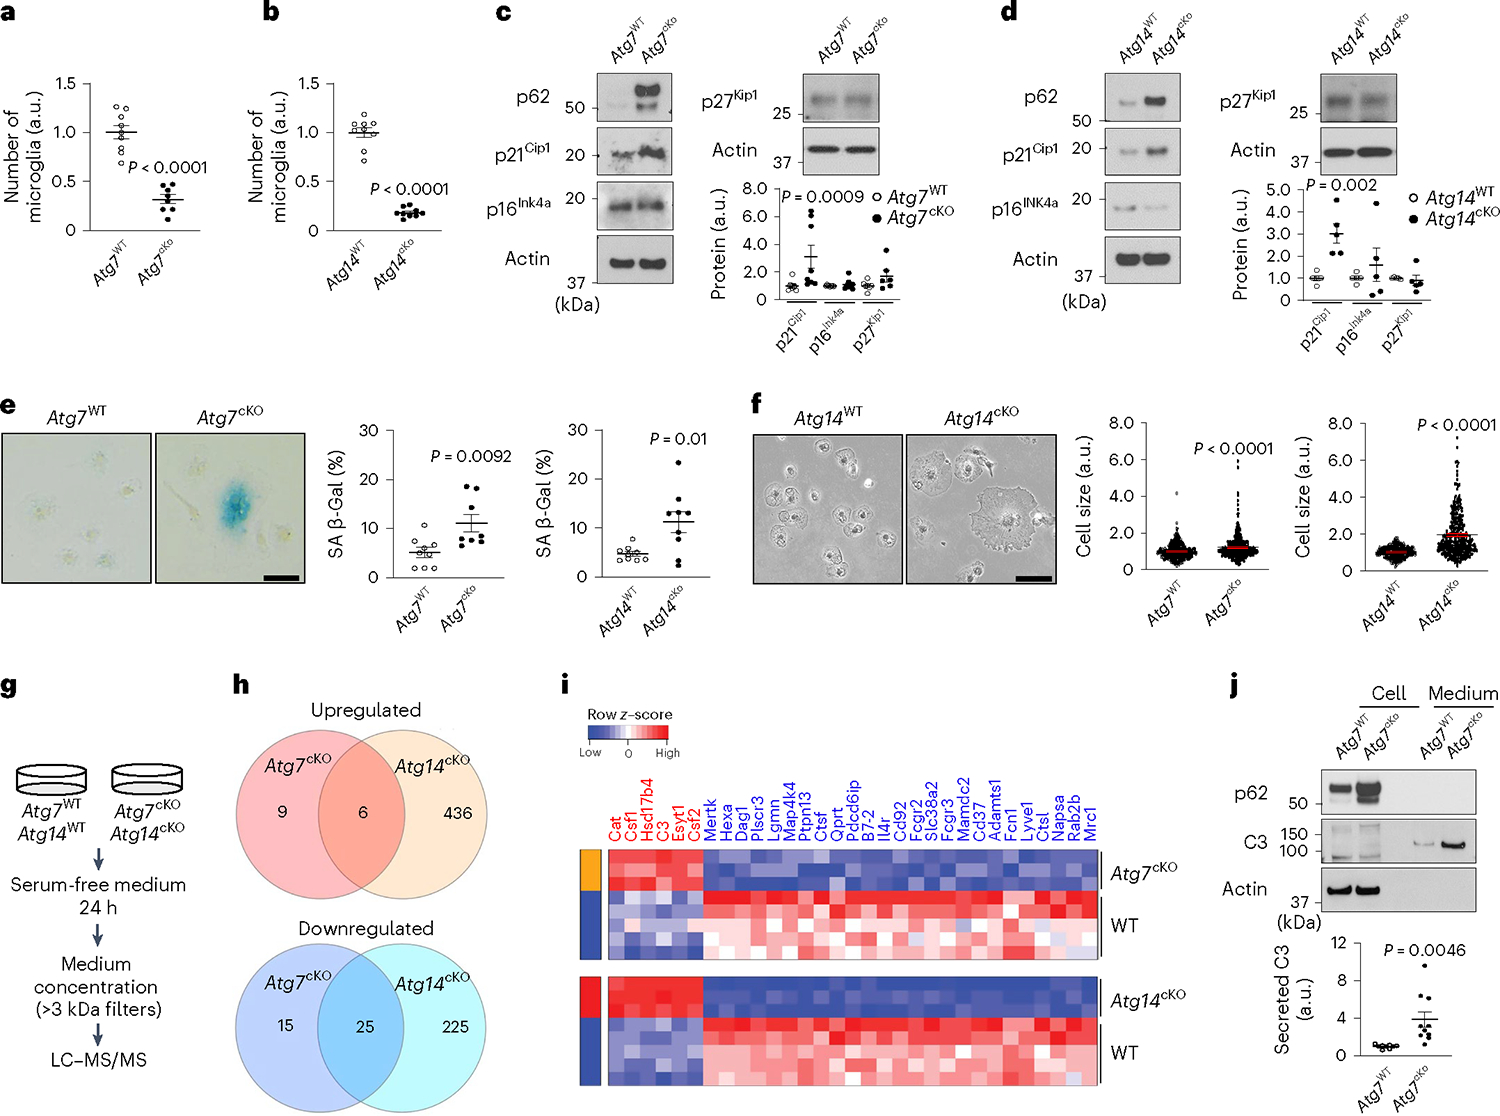
Fig. 5 |. Characterization of autophagy-deficient microglia and cellular senescence in vitro.

a,b, Primary microglia were cultured from Atg7cKO microglia (n = 8, littermate control n = 9) or Atg14cKO microglia (n = 9, littermate control n = 9). The number of microglia was counted. P < 0.0001 for both genotypes. c,d, The levels of CDKIs, p21Cip1, p16Ink4a and p27Kip1, were measured by western blot from Atg7cKO microglia (n = 8 for p21Cip1 and p16Ink4a; n = 6 for p27Kip1) and littermate controls (n = 9 for p21Cip1 and p16Ink4a; n = 7 for p27Kip1) or Atg14cKO microglia (n = 5, littermate controls n = 5, for all CDKIs). Actin was used as loading controls. For p21Cip1, P = 0.0009 for Atg7cKO; P = 0.002 for Atg14cKO. e, Senescence-associated β-galactosidase activity (SA-β-Gal) was measured from Atg7cKO microglia (n = 8, littermate controls n = 9) or Atg14cKO microglia (n = 9, littermate controls n = 9). P = 0.0092 for Atg7cKO; P = 0.01 for Atg14cKO. Scale bar, 20 μm. f, Cell sizes were measured from Atg7cKO microglia (340 cells, n = 3; littermate controls 369 cells, n = 3) or Atg14cKO microglia (306 cells, n = 6; littermate controls 332 cells, n = 4). P < 0.0001 for genotypes. Scale bar, 20 μm. g, Experimental scheme for SASP analysis. h,i, Venn diagram (h) and heat map (i) showing commonly upregulated (top) or downregulated (bottom) secreted proteins from Atg7cKO (P < 0.05, FC >1.25 or <0.8) and Atg14cKO microglia (FDR <0.05, FC >1.25 or <0.8) compared with controls. j, The levels of C3 protein in cell lysate (lanes 1 and 2) and medium (lanes 3 and 4) from Atg7cKO microglia (n = 10) and littermate controls (n = 9) were measured through western blot and quantified. P = 0.0046. P values were calculated by unpaired two-tailed Student’s t-test (a–e and j) or two-tailed Mann–Whitney U test (f). All values are reported as mean ± s.e.m. Source numerical data and unprocessed blots are available in source data.
