
Extended Data Fig. 2 |. Altered p-ACC and autophagy gene expression in the DAM of 5xFAD mice.
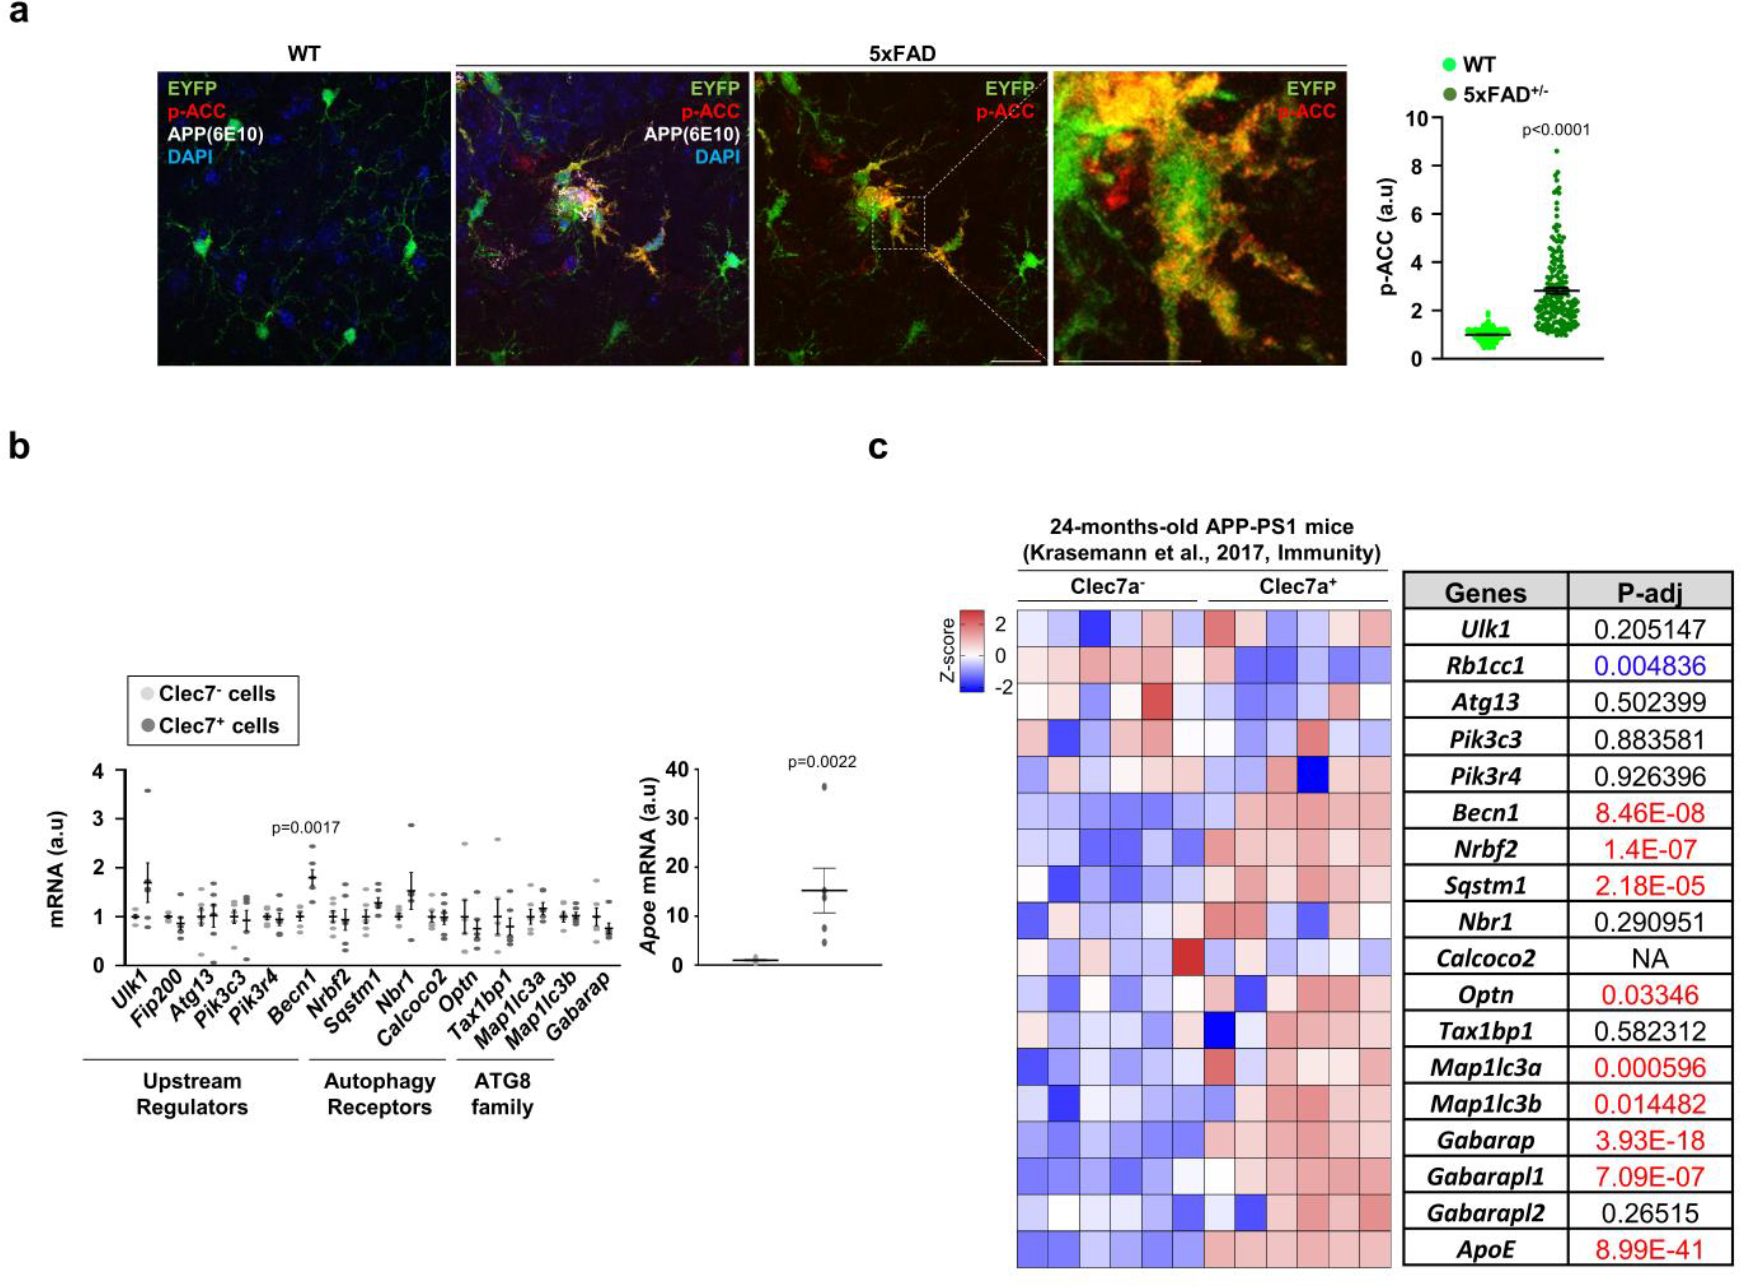
(a) The staining intensities of p-ACC in EYFP+ microglia were determined using Imaris software (see method) from Cx3cr1CreER; 5xFAD brains (3 female mice, 178 cells) and Cx3cr1CreER brains (3 female mice, 268 cells). No tamoxifen injection. p < 0.0001. Scale bar, 20 μm. (b) Clec7a+ and Clec7a−microglia (CD11b+ and CD45Low) from 5xFAD mice (2 male and 4 female mice) were collected and processed for RT-qPCR using primers detecting autophagy-essential genes. The level of Apoe was used for validating Clec7a+ and Clec7a−microglia populations. p = 0.0017 for Becn1; p = 0.0017 for Apoe. p-values were calculated by unpaired two-tailed Student’s t-test. All values are reported as mean ± SEM. (c) Heatmap showing the expression of essential autophagy genes through re-analysis of bulk-RNA sequencing data of Clec7a+ and Clec7a−microglia collected at 24-months-old APP/PS1 mice. p-values were calculated by unpaired two-tailed Student’s t-test (b) or two-tailed Mann-Whitney U test (a). p-values were calculated from Deseq2 analysis pipeline (c). All values are reported as mean ± SEM. Source numerical data are available in source data.