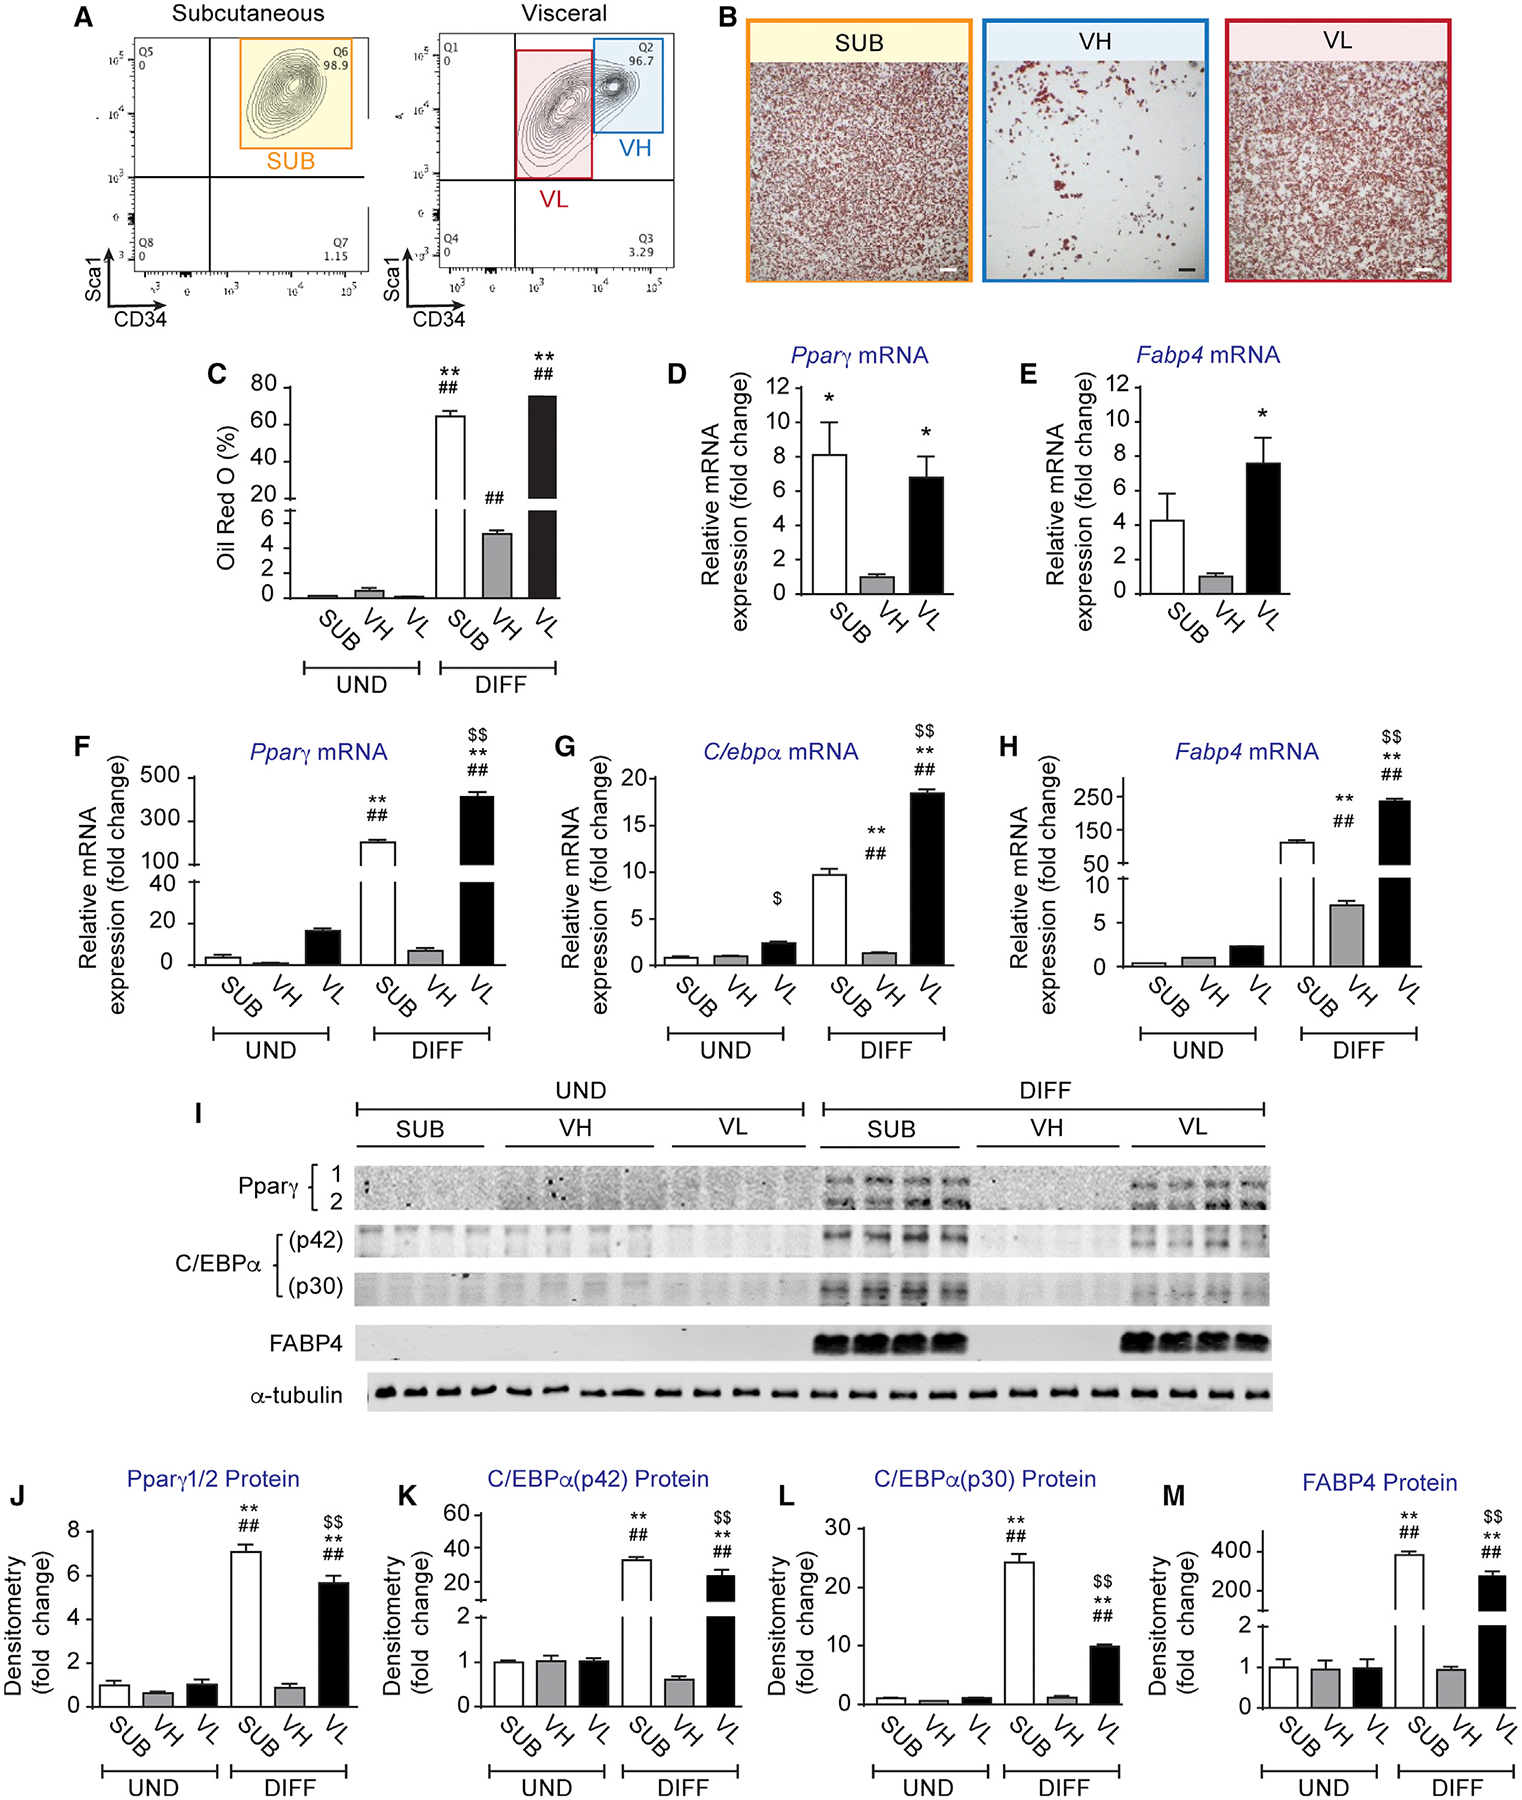
Figure 1. Distinct Adipogenic Potential among Visceral Adipose Tissue Progenitors.

(A) FACS plots of Lin−, CD29+ Sca1+, and CD34+ adipose progenitors (APs) in subcutaneous (inguinal) and visceral (epididymal) adipose tissue of C57BL/6 control mice.
(B) Representative images of oil red O staining of differentiated subcutaneous (SUB), visceral low (VL), and visceral high (VH) APs.
(C) Oil red O quantification expressed as percentage of staining. (D and E) Relative mRNA expression of (D) Pparγ and (E) Fabp4 in sorted not cultured VH, SUB, and VL AP subsets, respectively, expressed as fold change from VH.
(F–H) Relative mRNA expression of (F) Pparγ, (G) C/ebpα, and (H) Fabp4 in undifferentiated (UND) and 6-days-differentiated (DIFF) VH, SUB, and VL APs, respectively, expressed as fold change from VH.
(I) Representative Western blots of Pparγ, C/ebpα, Fabp4, and α-Tubulin expression in UND and 6-days-DIFF VH, SUB, and VL APs.
(J–M) Densitometry of (J) Pparγ, (K) C/ebpα (p42), (L) C/ebpα (p30), and (M) Fabp4 protein expression normalized by α-Tubulin and expressed as fold change from VH.
Values are mean ± SEM (*p < 0.05; **p < 0.005 versus VH under the same condition; ##p < 0.005 versus UND within the same progenitor subset; $ $p < 0.005 versus SUB under the same condition (n = 3–4 independent experiments, each including 10–15 mice each). Scale bar in (B) is 400 μm.
