
Figure 4. Visceral High AP Proportions Correlate Positively with Visceral Adipose Tissue Healthy and Unhealthy Expansion.
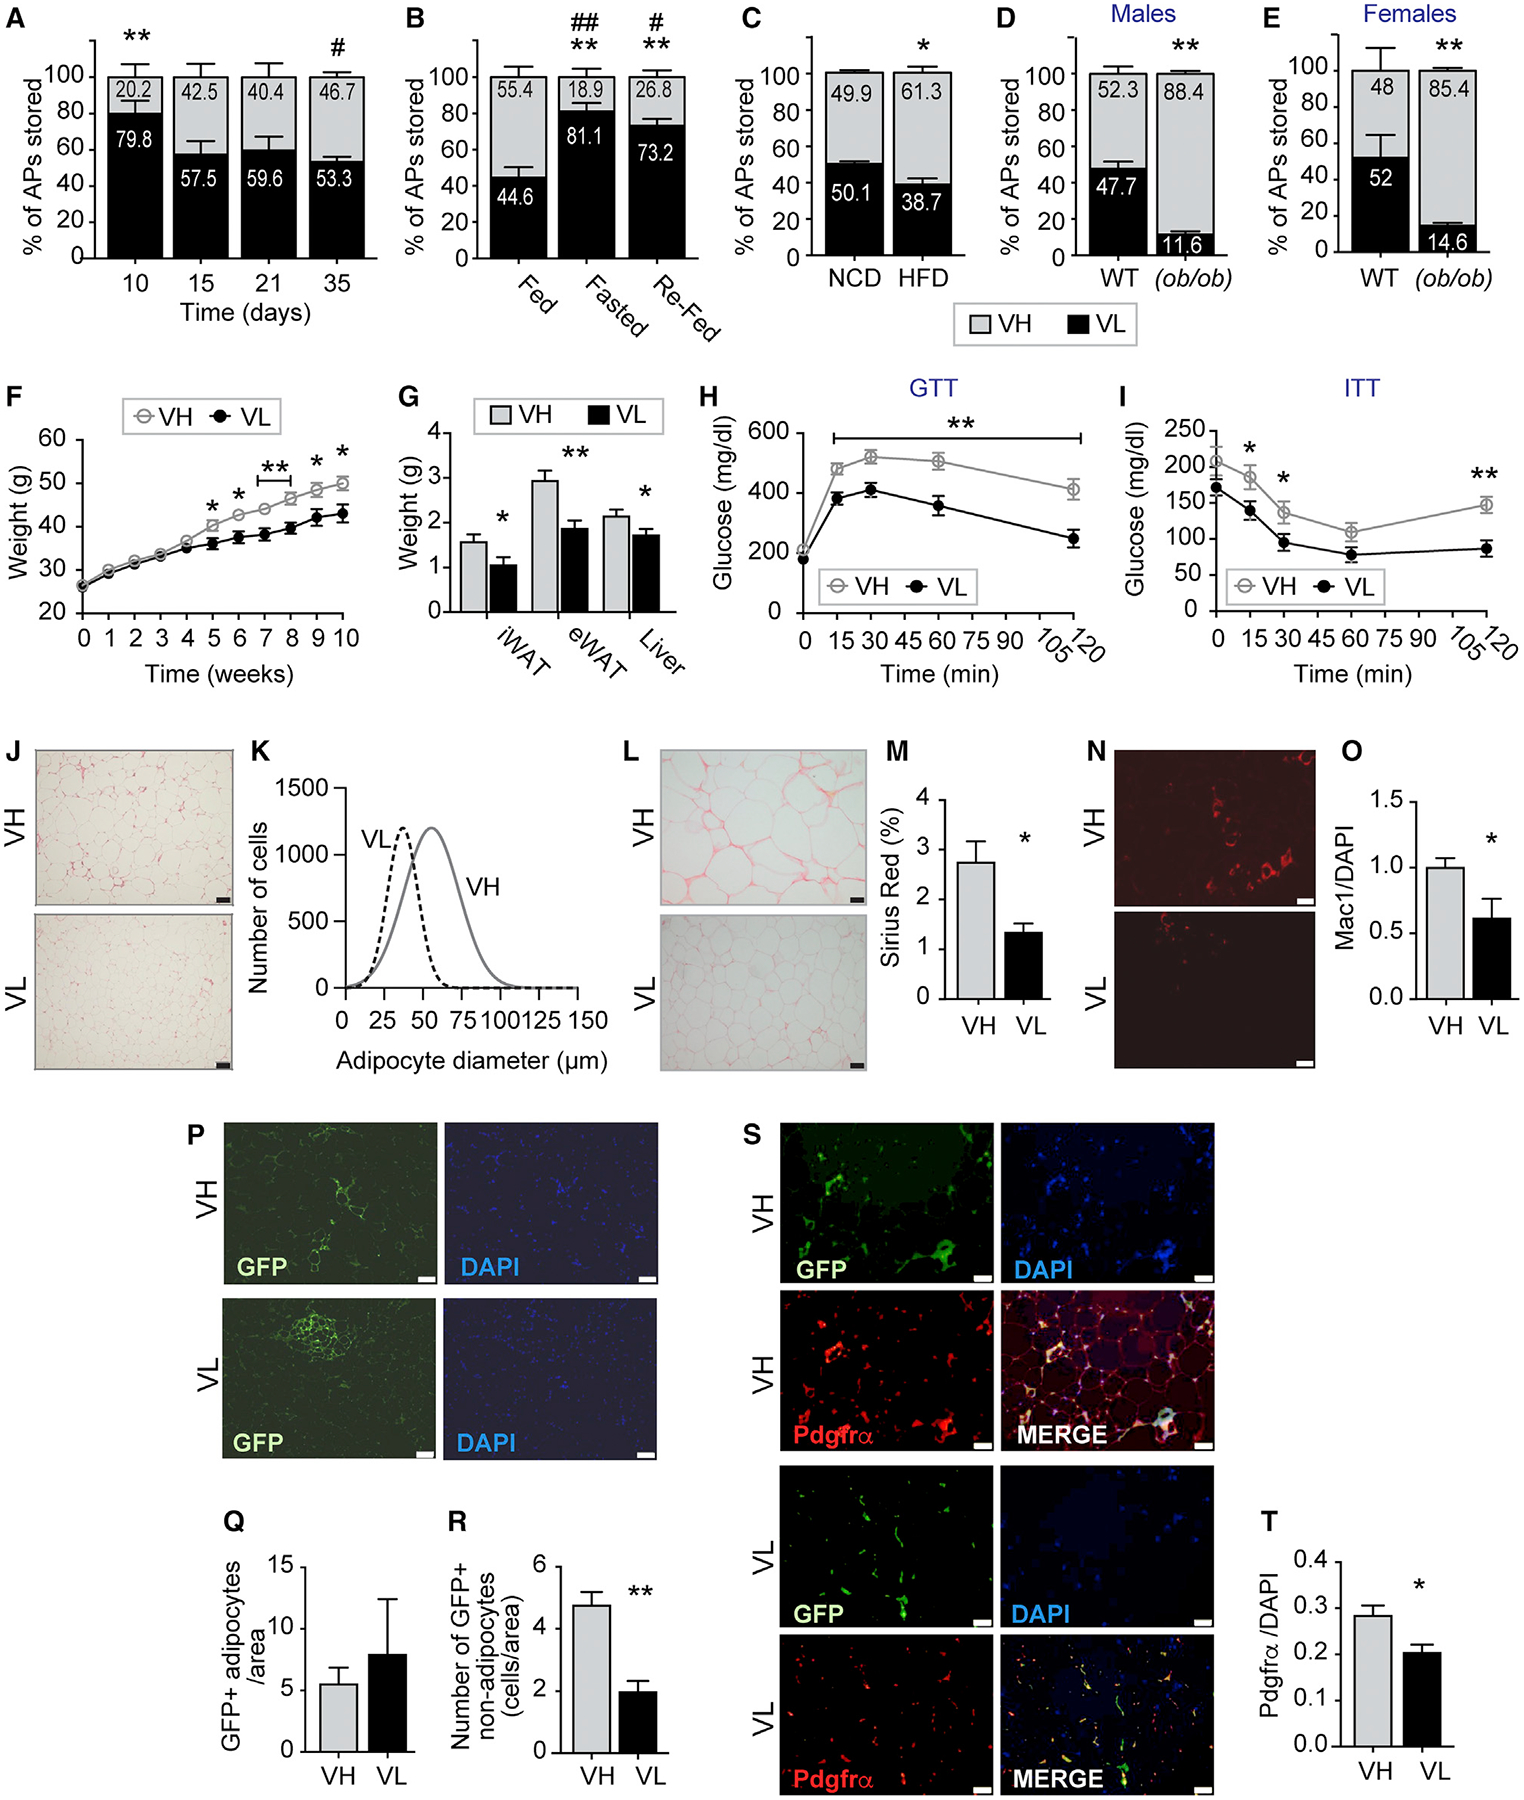
(A) Visceral high and low AP proportions in C57BL/6 male mice at post-natal day 10, 15, 21, and 35, respectively.
(B) Visceral high and low AP proportions in C57BL/6 male mice fed, fasted, or fasted and then refed.
(C) Visceral high and low AP proportions in C57BL/6 male mice fed normal chow diet (NCD) or high-fat diet (HFD) for 7 weeks.
(D and E) Visceral high and low AP proportions in male (D) and female (E) (ob/ob) and wild-type mice, respectively.
(F–T) Visceral low and high APs were isolated from eWAT of UBC-GFP transgenic male mice and transplanted into C57BL/6 recipient mice. Mice were fed HFD for 10 weeks before being sacrificed.
(F) Body weights in transplanted mice.
(G) Inguinal (iWAT), epididymal (eWAT), brown adipose tissue (BAT), and liver weights normalized by body weights in C57BL/6 recipient mice.
(H) Glucose tolerance test (GTT) of VIS low and VIS transplanted mice.
(I) Insulin tolerance test (ITT) of VIS low and VIS transplanted mice.
(J) Representative images of eWAT sections of VIS low and VIS transplanted mice stained with H&E.
(K) Adipocyte diameter in eWAT of VIS low and VIS transplanted mice.
(L and M) Representative images of eWAT of VIS low and VIS transplanted mice stained with Sirius Red (L) and the corresponding quantification (M) expressed as percentage.
(N and O) Representative images of eWAT of VIS low and VIS transplanted mice stained with Mac1 antibody (N) and the corresponding quantification (O) normalized by DAPI.
(P–R) Representative images of eWAT of VIS low and VIS high transplanted mice stained with GFP antibody (P) and quantification of GFP-labeled adipocytes (Q) and non-adipocytes (R) normalized by DAPI.
(S and T) Representative images of eWAT of VIS low and VIS transplanted mice stained with Pdgfrα antibody (S) and the corresponding quantification (T) normalized by DAPI.
Values are mean ± SEM (*p < 0.05; **p < 0.005 versus VH under the same condition; #p < 0.05; ##p < 0.005 versus 10 days, fed or NCD within the same progenitors subset; n = 5–12 mice per group). Scale bar size is 50 μm.