. 2024 Mar 19;12:RP88866. doi: 10.7554/eLife.88866

Figure 3. AMT1 and AMT2 are localized at the apicoplast membrane and essential for parasite growth in vitro.

(A) Western blot detection of protein depletion in the IAA-inducible degron (AID) lines. The lines were induced by auxin (IAA) for different hours (hrs) as indicated. Western blots detected immatured (p) and matured (m) forms of the protein fusions in the non-induced lanes. Actin served as the control. (B) Indirect fluorescence assay (IFA) detection of protein depletion in the AID lines. Parasites were grown in IAA for 24 hr, followed by IFA with antibodies against Ty or HA (red) and IMC1 (green). Scale = 5 μm. (C–E) Plaque formation by the TIR1 and AID lines on HFF monolayers in ±IAA for 7 days. Numbers (D) and sizes (E) of the plaques were measured by ImageJ. Scale = 0.5 cm. Two independent experiments with triplicates were performed. Data are shown as a mean ± standard error of the mean (SEM). (F) Parasite replication of the TIR1 and AID lines grown in IAA. The parasites were grown in IAA for 24 hr, followed by scraping, harvesting and infection for the 2nd and 3rd rounds of parasite growth in IAA. The parasites stained with GFP45 were counted in vacuoles (at least 150 vacuoles in each replicate). In comparing to TIR1 (1st, 2nd, and 3rd), p < 0.0001 for the AID lines with 2 and 8 parasites/vacuole in the 1st round, and for the AID lines with 1–8 parasites/vacuole in the 2nd round, p < 0.0001 for the AID lines with 1 and 4 parasites/vacuoles in the 3rd round. (G, H) Acyl carrier protein (ACP) diffusion in the TIR1 and AID lines grown in IAA. Parasites were grown in IAA for the 1st, 2nd, and 3rd lytic cycles, as described in the parasite replication assay (intracellular parasites). Those parasites in the 1st and 2nd round of growth were forced to egress for the same analysis (extracellular parasites). Vacuoles or single parasites were scored (n > 150 for each replicate). Fields/images were selected blind and all parasites/vacuoles were scored on the same fields/images (F–H). Three independent experiments with triplicates were performed (A, B, C, F, G, and H), and representative images were shown for A, B, and C, data are shown as a mean ± SEM with two-way analysis of variance (ANOVA) with Tukey’s multiple comparisons (compared with the TIR1). ***p < 0.0001.

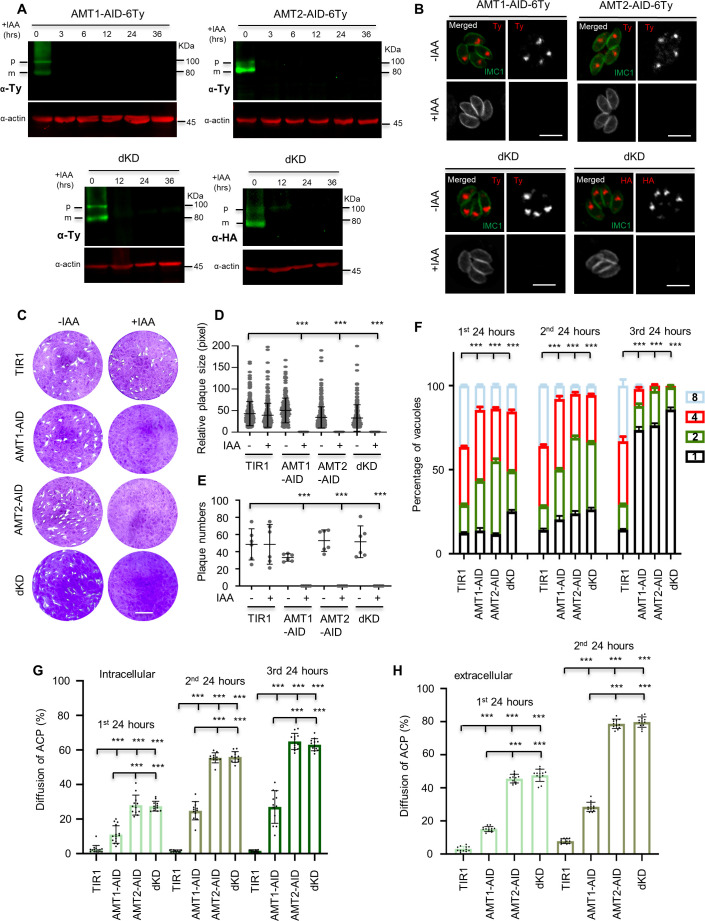
Figure 3—source data 1. PDF file containing the uncropped western blot gels for verification of the IAA-inducible degron (AID) fusion lines in Figure 3A.
Figure 3—source data 2. Excel file containing RAW images of plaque assays and scoring results of the parasite growth and apicoplast stability in Figure 3.

Figure 3.

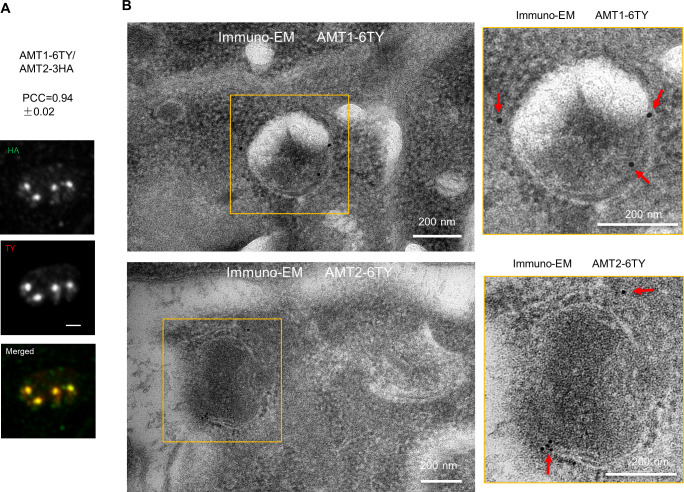
Figure 3—figure supplement 1. AMT1 and AMT2 are co-localized in the apicoplast.

Figure 3—figure supplement 1.

(A) Confocal images showed co-localization of AMT1-6Ty and AMT2-6HA. PCC was analyzed over the merged fluoresent foci by the NIS Elemental AR system. Data are shown with a mean ± standard deviation (SD; N = 6). (B) Immuno-electron microscopy (immuno-EM) of AMT1-6Ty and AMT2-6Ty. Parasites were fixed, embeded, sliced and incubated sequentially with Ty antibodies and gold particle (15 nm for AMT1 and 10 nm for AMT2) conjugated with anti-mouse antibodies. Scale bars were indicated on the images, and red arrows showed the gold particles at the apicoplast membranes.
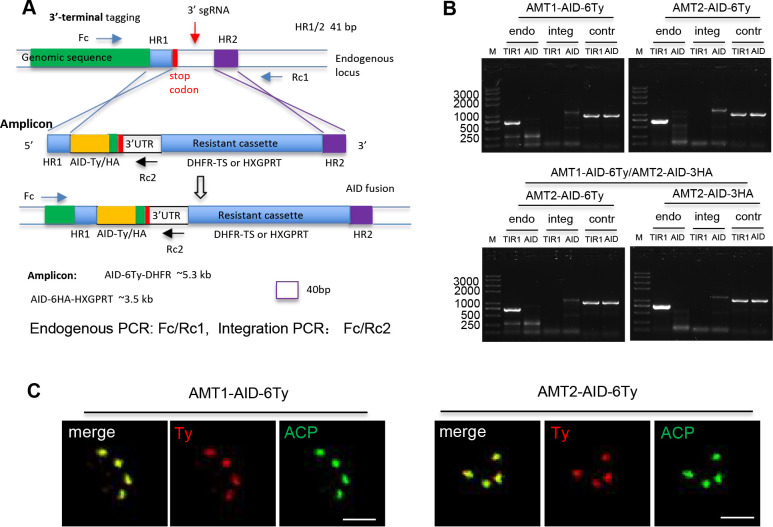
Figure 3—figure supplement 2. Diagnostic PCR of the AMT1-AID, AMT2-AID, and dKD lines.

Figure 3—figure supplement 2.

(A) Schematic diagram of the generation of the lines using a CRISPR-Cas9 approach. The sgRNA sequences were selected as described previously (Long et al., 2018), and integrated into a pCas9 plasmid using a DNA assembly method. The pCas9-sgRNA 3′ expresses Cas9 and sgRNA, which specifically cleave at the sgRNA region, creating a double strain DNA break (DSB) at the 3′ untranslated region of a specific gene. An amplicon containing an IAA-inducible degron (AID) fragment, a resistant cassette, and homologous regions (HR1 and HR2) at both ends was amplified from a generic plasmid. The HR1 and HR2 targeted the amplicon to integrate at the DSB, resulting in an in-frame integration of the AID fragment at the end of the encoding sequences. The primers were designed for diagnostic PCR for testing endogenous DNA and integration of the amplicon, and a scale bar was added at the bottom of the figure. (B) Diagnostic PCR of the AID lines. Endogenous (endo) and integration (integ) PCRs were performed with pairs of primers Fc/Rc (endo) and Fc/Rc2 (integ) as shown in (A), and the control (contr) PCR was performed with primers for the tubulin promoter region. The product sizes for the endo PCR in both the AID lines were 700 bp, while the sizes of the integ PCR were 1357 bp for AMT1-AID-6Ty, 1407 bp for AMT2-AID-6Ty, and 1326 bp for AMT2-AID-3HA. M, DNA marker. (C) Co-localization of AID-Ty fusions with the apicoplast marker ACP. Parasites were analyzed by IFA using antibodies against Ty (red) and ACP (green), followed by secondary antibodies conjugated with Alexa Fluors. Scale = 5 μm.
Figure 3—figure supplement 2—source data 1. PDF file containing DNA gels for diagnostic PCR of the IAA-inducible degron (AID) fusion lines.
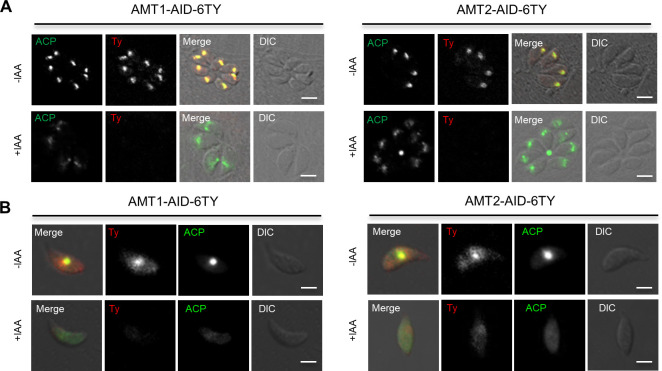
Figure 3—figure supplement 3. Depletion of AMT1 and AMT2 leads to apicoplast defects and loss of mitochondrial membrane potential in parasites.

Figure 3—figure supplement 3.

Parasites were grown in ±IAA, followed by fixation of intracellular parasites after 24 hr growth (A), or by fixation of extracellular parasites released mechanically after 24 hr growth (B). Indirect fluorescence assay (IFA) was performed with antibodies against epitope tag Ty (red) and apicoplast marker ACP (green). Examples of normal ACP localization, partial diffusion of ACP in the intracellular parasites (A), and a complete diffusion of ACP in the extracellular parasites (B) were shown for the lines of AMT1-AID and AMT2-AID. Scale = 5 μm. DIC, differential interference contrast.