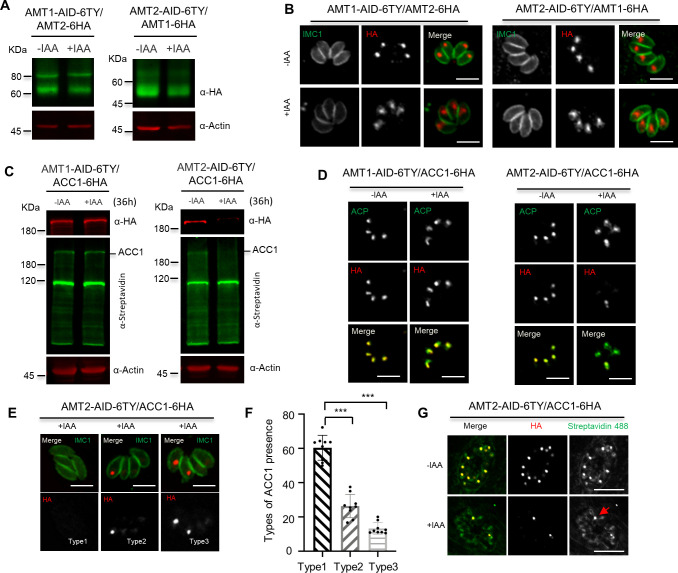
Figure 5. Depletiozn of AMT2 resulted in acetyl-CoA carboxylase 1 (ACC1) instability.
(A, B) No reciprocal effect on protein levels by depletion of AMT1 or AMT2. AMT1 and AMT2 were reciprocally tagged at C-terminus with 6HA in the IAA-inducible degron (AID) lines, and the HA fusions were detected by western blots in parasites in ±IAA for 36 hr (A), and by indirect fluorescence assay (IFA) in parasites in ±IAA for 24 hr (B). IFA was performed with IMC1 (green) and Ty/HA (red). (C, D) ACC1 was lost upon depletion of AMT2-AID. ACC1 was endogenously tagged with 6HA at its C-terminus in the AMT1-AID and AMT2-AID lines, and parasites were grown in IAA for 36 hr for western blots (C) and IFA (D). IFA analyses were performed with anti-ACP and anti-HA antibodies, while western blots were done with anti-HA and streptavidin Li-COR 800CW. Actin served as the control. (E, F) Representative images of ACC1 on IFA in parasites of AMT2-AID induced in IAA for 24 hr. ACC1 (red) was completely lost in parasites of a vacuole (type 1), remained only in one parasite of a single vacuole (type 2), or in two parasites of a single vacuole (type 3) (E). The ACC1 types were scored in AMT2-AID induced in IAA for 24 hr, and expressed as percentages of different types (F). At least 150 parasites were scored in each replicate. Three experiments with triplicates were performed, and data are shown as a mean ± standard error of the mean (SEM) and analyzed by two-way analysis of variance (ANOVA) with multiple comparison, ***p < 0.0001. (G) The remaining ACC1 was still biotinylated. Parasites were grown in ±IAA for 24 hr for IFA analysis with antibodies against HA and streptavidin Alexa Fluor 488. Parasites containing both ACC1-6HA (red) and biotinylated ACC1 (green) was observed. Three independent experiments were performed with similar outcomes, and representative images were shown. Scale = 5 μm.

