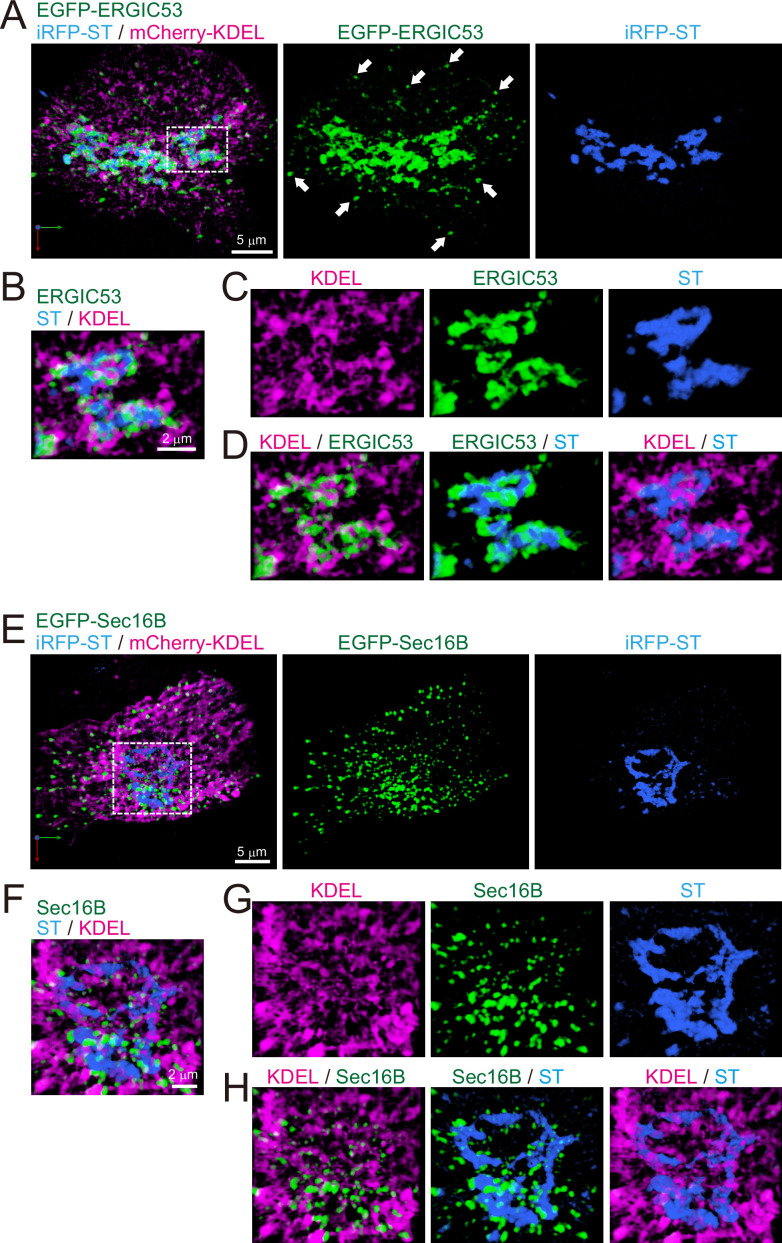
Figure 10. Distribution of endoplasmic reticulum-Golgi intermediate compartment (ERGIC), ER exit sites (ERES), Golgi, and ER in HeLa cells.
(A–D) Triple-color three-dimensional (3D) super-resolution confocal live imaging microscopy (SCLIM) images of the Golgi ribbon area of a HeLa cell expressing EGFP-ERGIC53 (ERGIC marker, green), iRFP-ST (Golgi marker, blue), and mCherry-KDEL (ER marker, magenta). (E–H) Triple-color 3D SCLIM images of the Golgi ribbon area of a HeLa cell expressing EGFP-Sec16B (ERES marker, green), iRFP-ST (blue), and mCherry-KDEL (magenta). (A and E) Images of the whole Golgi ribbon. The left panels show merged images. The center and right panels show EGFP and iRFP fluorescence signals, respectively. (B–D and F–H) Zoom-up images of a portion of the Golgi ribbon in the white dashed squares shown in (A) and (E). (B and F) Triple-merged images. (C and G) Single-channel images. (D and H) Dual-merged images. Arrows in (A): EGFP-ERGIC53-positive puncta distributed away from the Golgi ribbon. Scale bars: 5 μm (A and E) and 2 μm (B and F).

