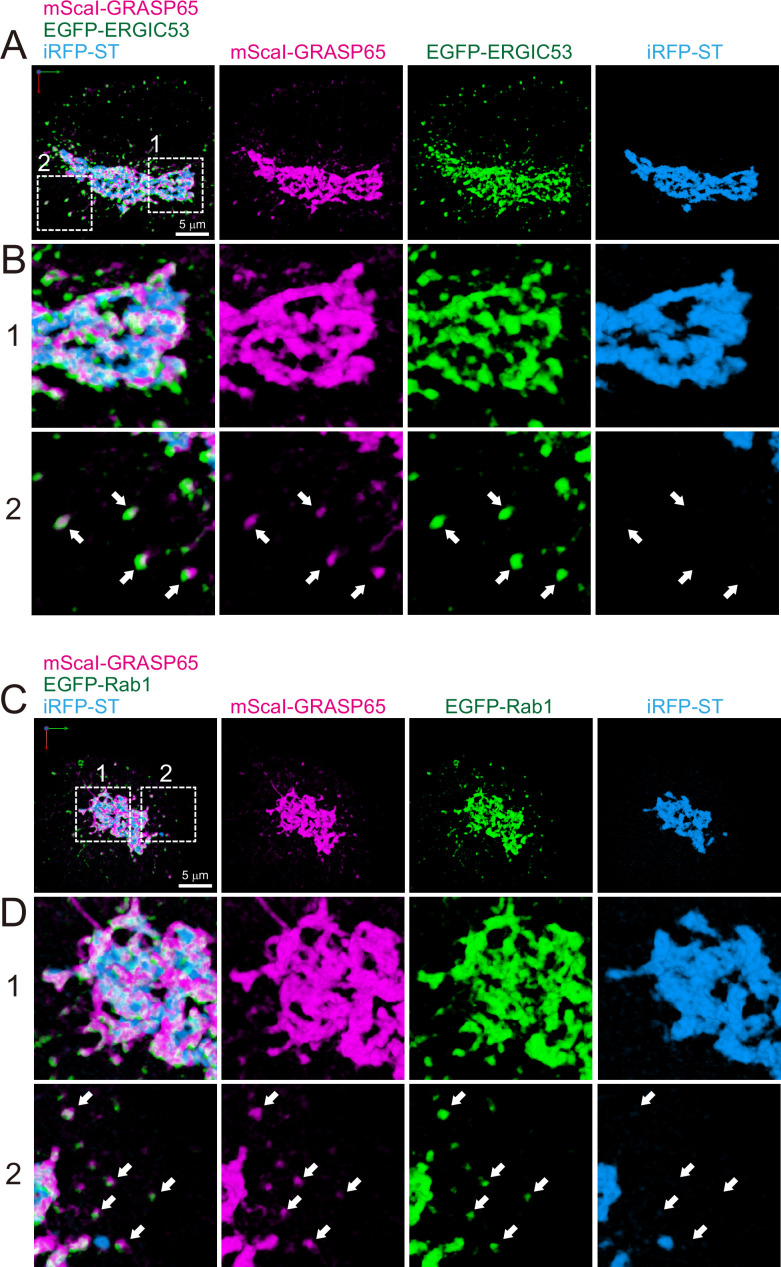
Figure 11. Distribution of endoplasmic reticulum-Golgi intermediate compartment (ERGIC) proteins (GRASP65, ERGIC53, and Rab1) in HeLa cells.
(A and B) Triple-color three-dimensional (3D) super-resolution confocal live imaging microscopy (SCLIM) images of the Golgi ribbon area of a HeLa cell expressing mScarlet-I (mScaI)-GRASP65 (magenta), EGFP-ERGIC53 (green), and iRFP-ST (Golgi marker, blue). (C and D) Triple-color 3D SCLIM images of the Golgi ribbon area of a HeLa cell expressing mScaI-GRASP65 (magenta), EGFP-Rab1 (green), and iRFP-ST (blue). Scale bars: 5 μm. (A and C) Images of the whole Golgi ribbon. The left-most panels show merged images. The right panels show mScaI, EGFP, and iRFP fluorescence signals, respectively. (B and D) Zoom-up images in the white dashed squares (1 and 2) shown in (A) and (C). Arrows indicate that mScaI-GRASP65 and EGFP-ERGIC53/Rab1 double positive but iRFP-ST-negative puncta distributed away from the Golgi ribbon.

