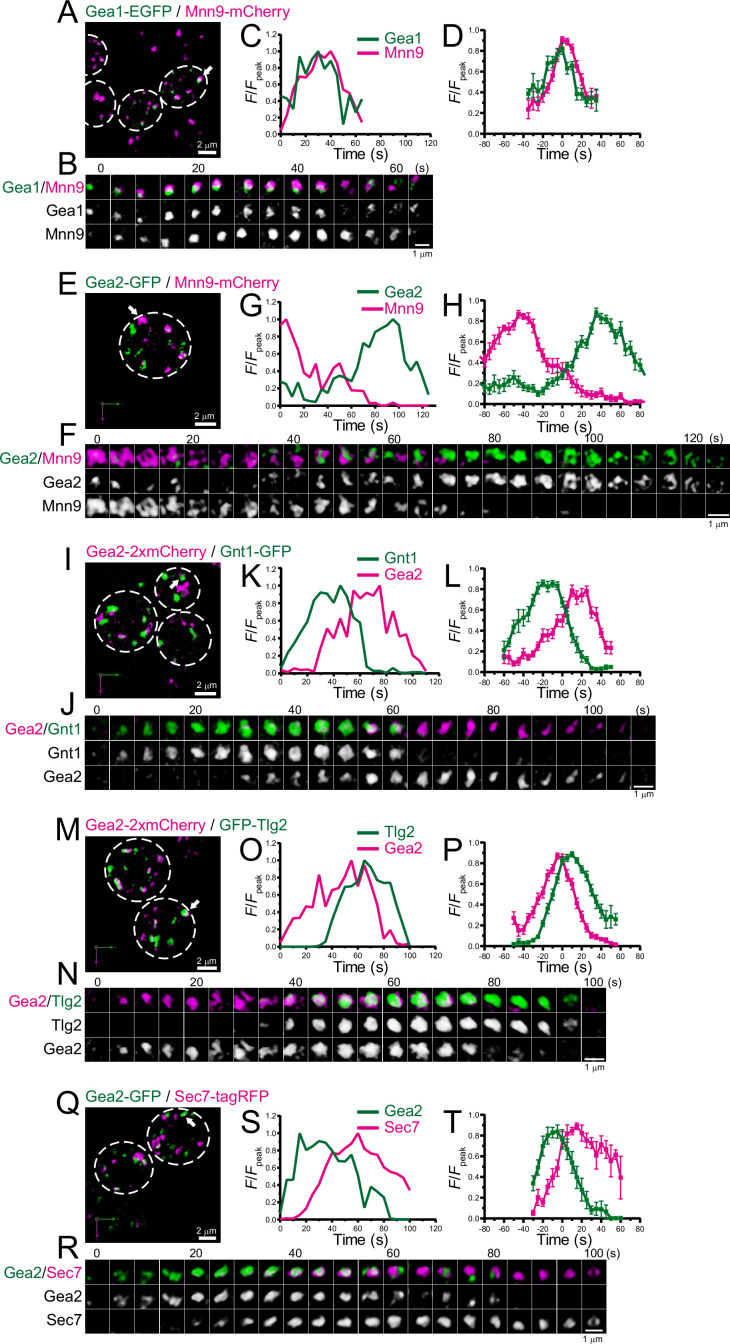
Figure 7. Four-dimensional (4D) dynamics of Gea1 and Gea2.
Dual-color 4D super-resolution confocal live imaging microscopy (SCLIM) imaging of yeast cells expressing Gea1-EGFP and Mnn9-mCherry (A–D), Gea2-GFP and Mnn9-mCherry (E–H), Gea2-2xmCherry and Gnt1-GFP (I–L), Gea2-2xmCherry and GFP-Tlg2 (M–P), and Gea2-GFP and Sec7-tagRFP (Q–T). (A, E, I, M, and Q) Low-magnification images of the cells. The white broken lines indicate the edge of the cells. (B, F, J, N, and R) Time-lapse images of the single cisternae (white arrows in A, E, I, M, and Q, respectively) in the cells. (C, G, K, O, and S) Time course changes in relative fluorescence intensities (F/Fpeak) of green and red channels in B, F, J, N, and R, respectively. (D, H, L, P, and T) Averaged time course changes in F/Fpeak of green and red channels (mean ± SEM). Time 0 was set as the midpoint between the green and red fluorescence peaks of each cisterna (n=15, 13, 15, 21, and 7 cisternae for D, H, L, P, and T, respectively). Scale bars: 2 μm (A, E, I, M, and Q) and 1 μm (B, F, J, N, and R).


