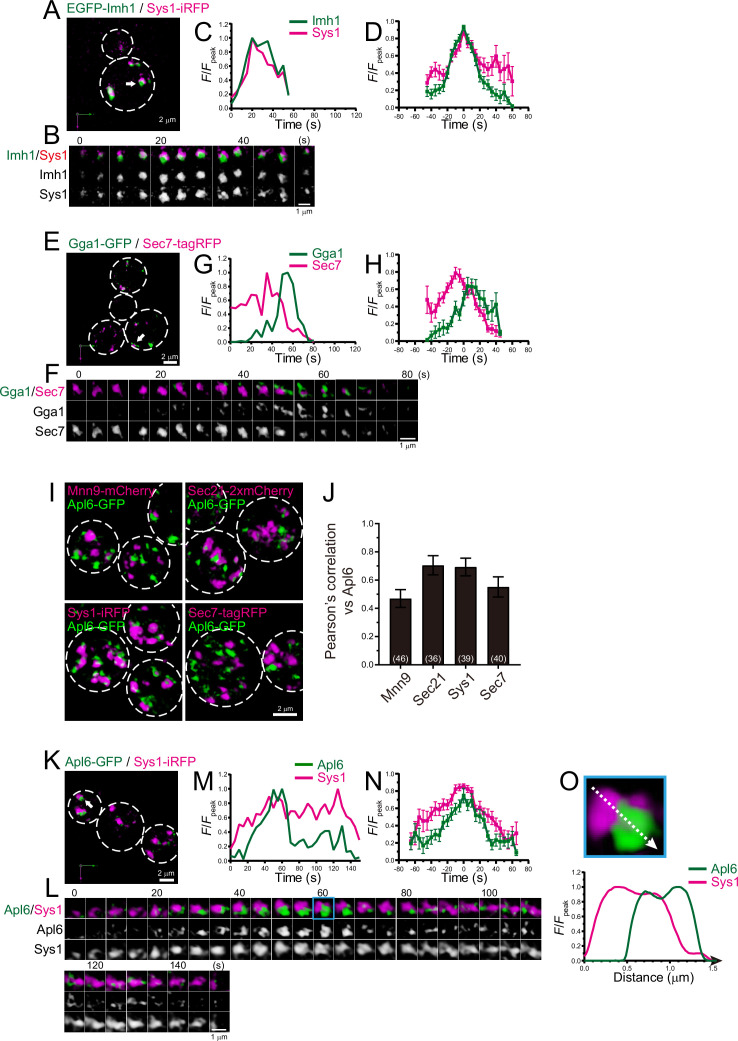
Figure 8. Four-dimensional (4D) dynamics and 3D distribution of Imh1, Gga1, and Apl6.
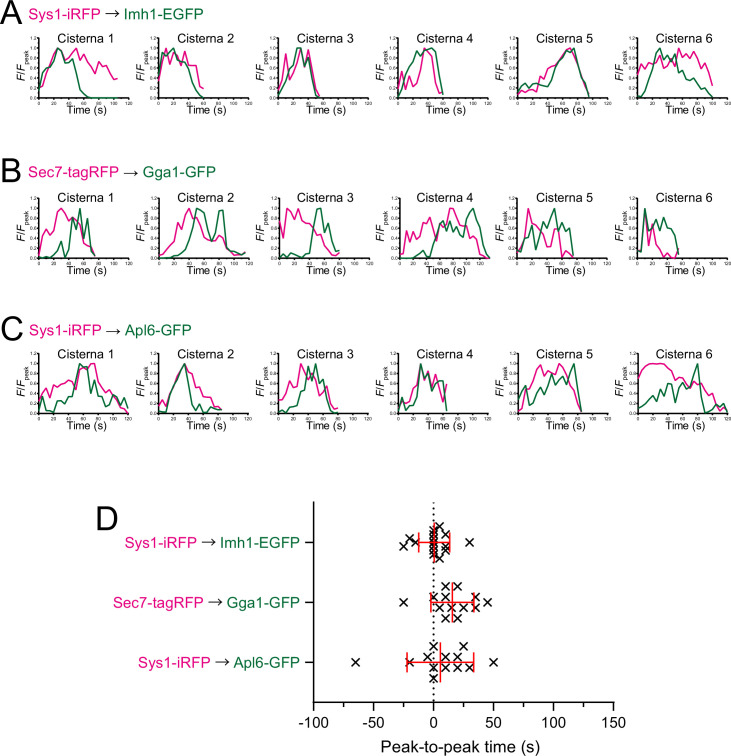
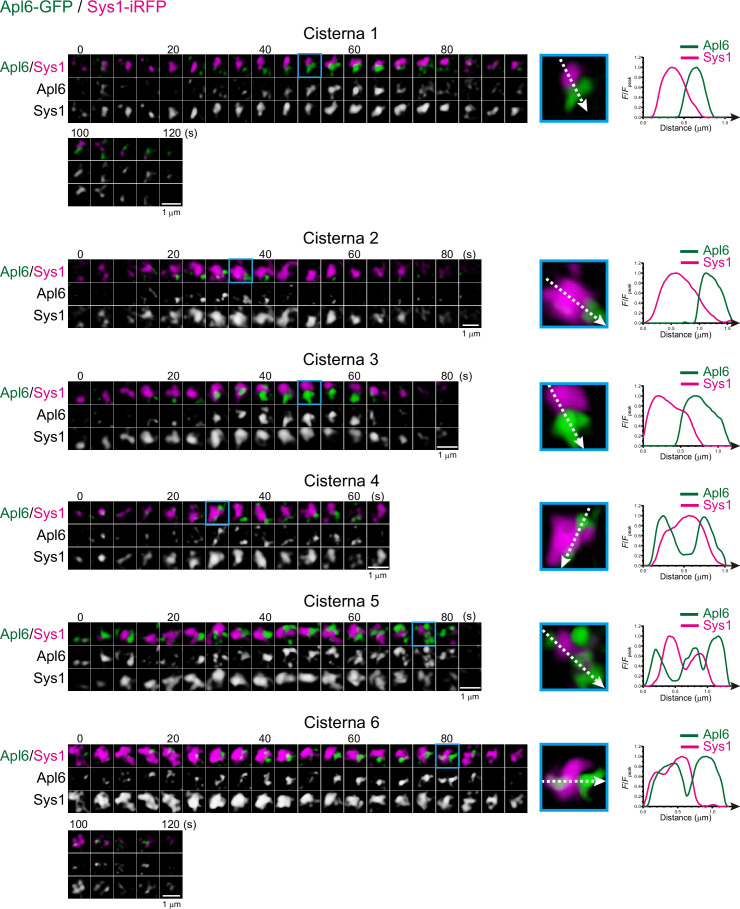
(A–H) Dual-color 4D super-resolution confocal live imaging microscopy (SCLIM) imaging of yeast cells expressing EGFP-Imh1 and Sys1-iRFP (A–D), and Gga1-GFP and Sec7-tagRFP (E–H). (A and E) Low-magnification images of the cells. The white broken lines indicate the edge of the cells. (B and F) Time-lapse images of the single cisternae (white arrows in A and D, respectively) in the cells. (C and G) Time course changes in relative fluorescence intensities (F/Fpeak) of green and red channels in B and E, respectively. (D and H) Averaged time course changes in F/Fpeak of green and red channels (mean ± SEM). Time 0 was set as the midpoint between the green and red fluorescence peaks of each cisterna (n=16 and 13 cisternae for D and H, respectively). (I and J) 3D co-localization analyses of Apl6 versus Golgi/trans-Golgi network (TGN) marker proteins. (I) GFP-Apl6 was co-expressed with Mnn9-mCherry (cis-Golgi), Sec21-2xmCherry (cis/medial-Golgi), Sys1-iRFP (trans-Golgi), and Sec7-tagRFP (TGN) and imaged by dual-color 3D SCLIM. (J) Pearson’s correlation coefficient (r) for co-localization of the indicated proteins versus Apl6. Numbers in parentheses indicate the number of cells examined. Each value represents mean ± SD. (K–O) Dual-color time-lapse SCLIM imaging of yeast cells expressing Apl6-GFP and Sys1-iRFP. (K) Low-magnification image of the cells. The white broken lines indicate the edge of the cells. (L) Time-lapse images of the single cisterna (white arrows in K) in the cell. (M) Time course changes in relative fluorescence intensities (F/Fpeak) of green and red channels in L. (N) Averaged time course changes in F/Fpeak of green and red channels (mean ± SEM). Time 0 was set as the midpoint between the green and red fluorescence peaks of each cisterna (n=13 cisternae). (O) Magnified image and line scan analyses of Apl6-GFP and Sys1-iRFP signals in the single maturing cisterna (blue rectangle in L). The F/Fpeak values (green and red channels) along the white broken lines in the upper panels are profiled in the graphs below. Scale bars: 2 μm (A, E, I, and L) and 1 μm (B, F, and L).


