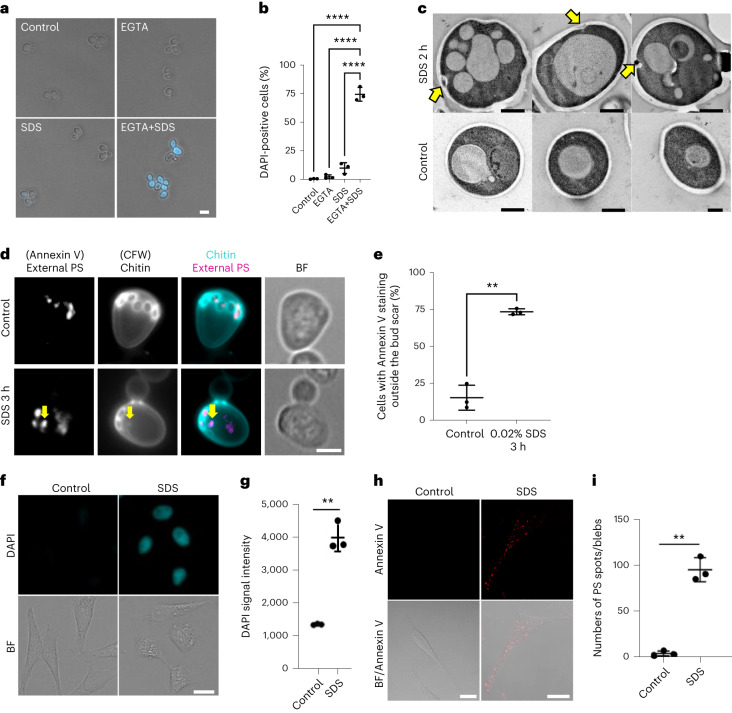
Fig. 1. SDS induces PMD in yeast and human cells.
a, Wild-type yeast cells were cultured in YPD and then incubated with 2 ng ml−1 DAPI-containing YPD with or without 20 mM EGTA and 0.02% SDS for 15 min. Scale bar, 5 μm. b, Quantification of a. Data are presented as mean (horizontal bars) ± s.d. (whiskers) of three independent experiments (n > 300 cells per each experiment). ****P < 0.001: control versus EGTA+SDS: <0.0001; EGTA versus EGTA+SDS: <0.0001; EGTA versus EGTA+SDS: <0.0001, by two-tailed unpaired Student’s t-test. c, Wild-type yeast cells were cultured at 25 °C and then incubated with 0.02% SDS for 2 h. Cells were fixed and observed by TEM. Yellow arrows, plasma membrane and cell wall ingression. Scale bar, 1 μm. d, Wild-type yeast cells were cultured in YPD and then switched to YPD containing 0.02% SDS for 3 h. Yeast cells were treated with zymolyase in 1.2 M sorbitol for 90 min and then stained with Annexin V–Alexa Fluor 568 for 20 min. Yellow arrows, Annexin V and Calcofluor white positive spots. e, The percentage of cells with Annexin V staining outside of the bud scar was counted. Data are presented as mean (horizontal bars) ± s.e.m. (whiskers) of three independent experiments. n > 250 cells per each experiment. **P < 0.01, exact value: 0.005, by two-tailed unpaired Student’s t-test. Scale bar, 2 μm. f, Representative images of HeLa cells with DAPI signals upon 0.008% SDS treatment for 24 h. The cells were cultured in a DAPI-containing medium with or without 0.008% SDS. Scale bar, 20 μm. g, Quantification of DAPI intensity as in f. Data are presented as mean (horizontal bars) ± s.d. (whiskers) of three independent experiments. Untreated control and 0.008% SDS treatment were significantly different (**P < 0.01, exact value: 0.0086) using two-sided multiple Welch’s t-test with Benjamini, Krieger and Yekutieli correction. See also Extended Data Fig. 2. h, Representative images of the HeLa cells with Annexin V–positive spots/blebs upon 0.008% SDS treatment. Cells were cultured in a medium with or without 0.008% SDS for 1 h. Scale bar, 20 μm. BF, bright-field. i, Numbers of Annexin V–positive spots/blebs were counted as in h. Data are presented as mean (horizontal bars) ± s.d. (whiskers) of three independent experiments (black dots). See also Extended Data Fig. 3a. **P < 0.01, exact value: 0.000292, by two-tailed unpaired Student’s t-test.

