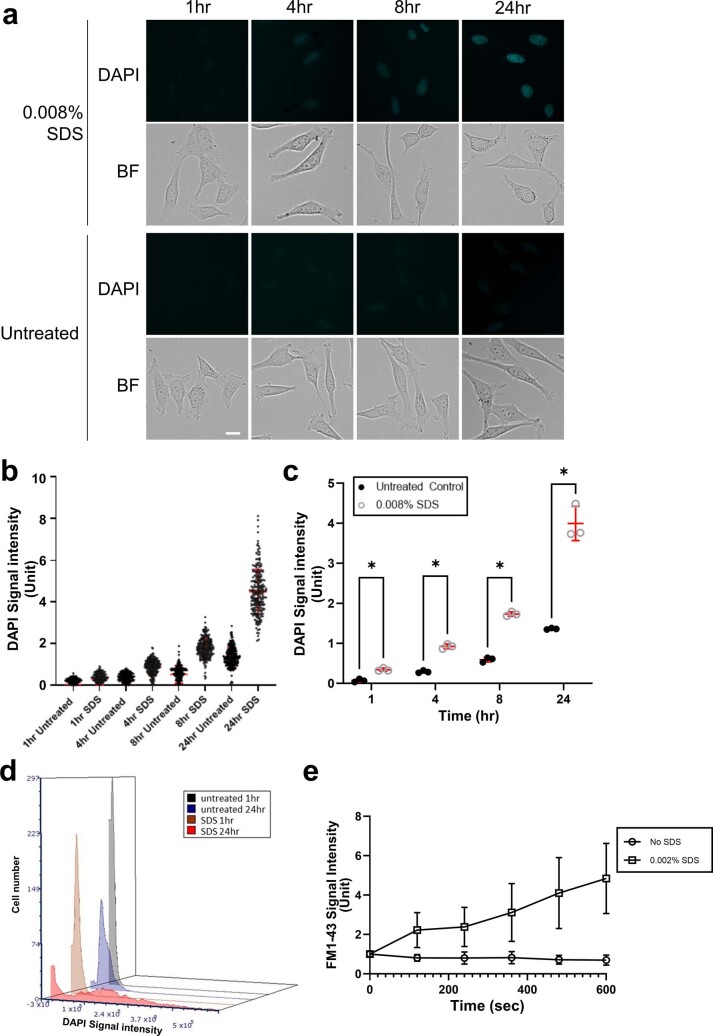
Extended Data Fig. 2. SDS induces plasma membrane damage in human cells.
(a) Representative images of DAPI penetrated HeLa cells upon 0.008% SDS treatment over time. HeLa cells were cultured in DAPI-containing medium with or without 0.008% SDS. Scale bar, 20 μm. This experiment was independently repeated three times with similar results. (b) A representative data set of DAPI penetration assay. DAPI positive cells were counted at indicated time points. Cell number: 1hr Untreated (n = 217), 1hr SDS (n = 208), 4hr Untreated (n = 211), 4hr SDS (n = 219), 8hr Untreated (n = 208), 8hr SDS (n = 212), 24hr Untreated (n = 212), 24hr SDS (n = 216). Data points are shown with Mean(SD). (c) Average DAPI intensity of three independent experiments as in (b). Untreated control and 0.008% SDS treatment were significantly different. P value: *<0.05, 1hr: 0.001066, 4hr: 0.000079, 8hr: 0.000018, 24hr: 0.000438, using two-sided multiple Welch’s t-test with Benjamini, Krieger and Yekutieli correction. Data points are shown with Mean(SD). (d) Flow cytometric analyses of penetrated DAPI signals are shown by histogram overlays. WI-38 cells were cultured in DAPI-containing medium with or without SDS (0.0085%). Cell number: untreated 1hr (n = 5029), untreated 24hr (n = 5025), SDS 1hr (n = 5007), SDS 24hr (n = 5192). (e) Live-cell imaging was performed using HeLa cells cultured in FM1-43-containing medium (no FBS) with or without 0.002% SDS. The cytosolic FM1-43 signals were quantified (8 cells per each group). n = 10 cells examined over 2 independent experiments. Graphs are shown as Mean(SD).

