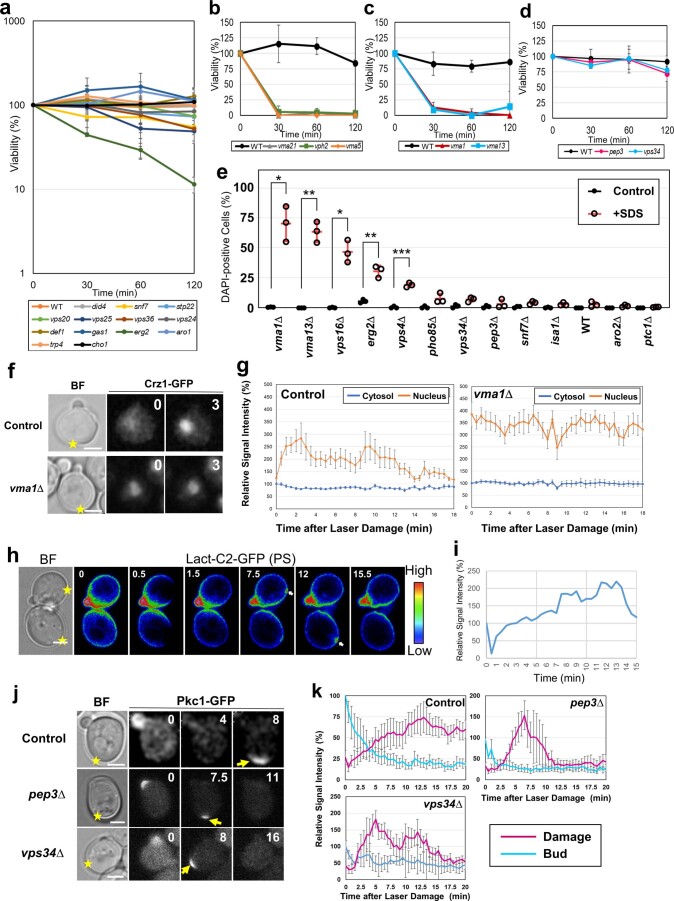
Extended Data Fig. 4. Identification and characterization of factors required for plasma membrane/cell wall damage response in budding yeast.
(a and b) Yeast gene deletion mutants were cultured in YPD at 25˚C and then incubated with YPD containing 0.02% SDS. Samples were collected at 30 min intervals and spread onto YPD plates. The number of colonies was counted after 2-3 days. Graphs are shown as Mean(SD) of 3 independent experiments. (c) Yeast mutants were treated as in (a) except for the usage of YPD (pH 5.0). (d) Yeast mutants were treated as in (a). (e) Yeast gene deletion mutants were cultured in YPD at 25˚C and then incubated with YPD containing 0.02% SDS for 30 min. Data are shown as Mean(SD) of 3 independent experiments. > 300 cells/sample. For statistical analysis, Control cells vs. +SDS cells were compared. P values: *, p < 0.05; **, p < 0.01; ***, p < 0.001, by 2-tailed unpaired Student’s t-test. Exact P value: vma1: 0.0146, vma13: 0.0062, vps16: 0.0129, erg2: 0.0081, vps4: 0.0006. (f) Wild type (Control) and vma1∆ expressing Crz1-GFP were cultured under the microscope and subjected to laser damage (yellow stars). Images were taken in 30 sec intervals. The numbers at the upper-right corners indicate the time (min). Scale bar, 2 μm. (g) Quantification of (f). Data are shown as Mean(SEM) of 8 independent experiments. (h) Wild type yeast expressing Lact-C2-GFP were cultured under the microscope and subjected to the laser damage as in (f). Relative signal intensity is shown in rainbow pseudocolor. The numbers at the left-top corners indicate the time (min). Arrows: the GFP signal accumulation at the laser damage sites. Scale bar, 2 μm. (i) Quantification of (h). Mean of 10 independent experiments. (j) Wild type (Control), pep3∆ and vps34∆ expressing Pkc1-GFP were cultured under the microscope and subjected to laser damage as in (f). Scale bar, 2 μm. (k) Quantification of (j). Control (n = 5), pep3 (n = 3), vps34 (n = 4) independent cells were examined. Mean(SEM).

