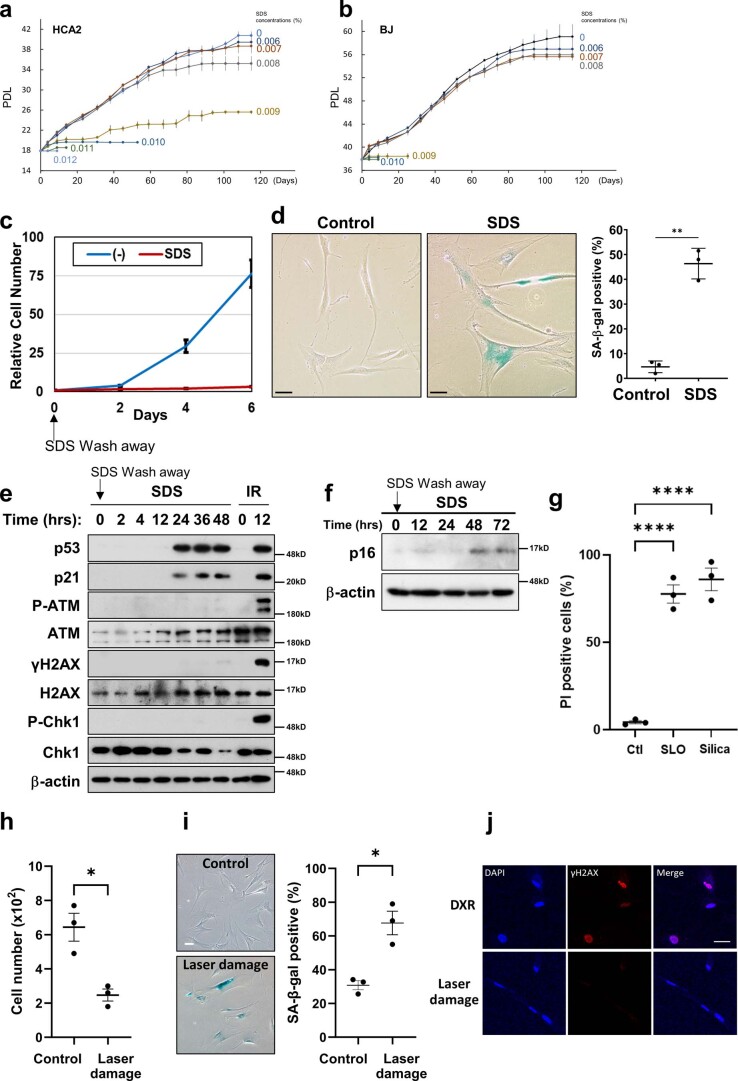
Extended Data Fig. 6. Transient plasma membrane damage induces premature senescence in normal human fibroblasts.
(a and b) PDL of human normal fibroblasts with continuous SDS treatment. Human normal fibroblasts (a: HCA2, b: BJ) were cultured with or without SDS (0.006–0.012%; indicated on the right). (c) Relative cell numbers of HCA2 cells after the transient (24 hours) SDS treatment. More than 1x10⁵ cells were quantified. HCA2 cells were incubated in the medium with (SDS) or without (-) 0.01% SDS for 24 hours, washed, and released into fresh medium. Data are shown as Mean(SD) of 3 independent experiments. (d) HCA2 cells were treated with 0.01% SDS for 24 hours, washed, and released into fresh medium. SA-β-gal positive cells were detected using the cells 6 days after SDS wash away. Scale bar, 50 μm. Graphs show quantification of SA-β-gal positive cells (n > 100). Data are shown as Mean(SD) of >3 independent experiments. P value: **<0.01, exact value: 0.0032, by 2-tailed unpaired Student’s t-test. (e and f) Western blotting using cell lysates of HCA2 cells treated with 0.01% SDS for 24 hours or 10 Gy IR (Irradiation, control). This experiment was independently repeated three times with similar results. (g) PI penetration assay was performed with 24 hours treatment of 200 ng/ml streptolysin O (SLO), 125 μg/ml silica (φ = 0.8 μm) (Silica). n > 100 cells. P value: ****<0.001, Control vs. SLO: <0.0001, Control vs. Silica: <0.0001, by One-way ANNOVA, Dunnett. (h) Cell number of WI-38 cells in 35 mm glass bottom dish was counted 10 days after laser irradiation. P value: *<0.05, exact value: 0.026, by 2-tailed unpaired Student’s t-test. (i) SA-β-gal positive cells were detected 16 days after laser irradiation. Scale bar, 50 μm. Graphs show quantification of SA-β-gal positive cells. n > 100 cells. P value: *<0.05, exact value: 0.0227, by 2-tailed unpaired Student’s t-test. (j) WI-38 cells just after laser irradiation or cells at 24 hours after DXR treatment were stained with γH2AX (red) and with DAPI (blue). Scale bar, 50 μm. Graphs are shown as Mean(SD) of 3 biological replicates.

