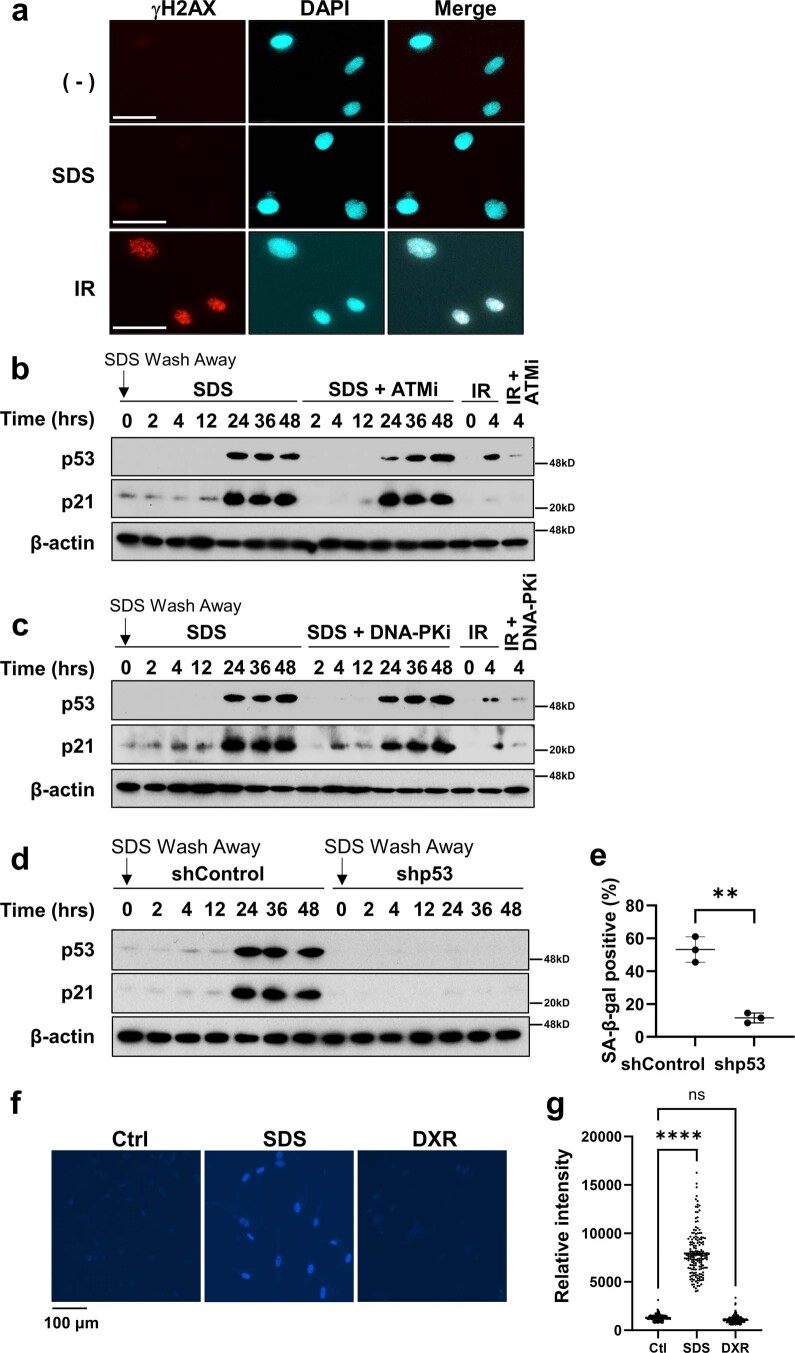
Extended Data Fig. 7. PMD-Sen induction requires p53 and doxorubicin does not induce plasma membrane damage.
(a) HCA2 cells at 24 hours after SDS wash away (SDS), cells at 4 hours after 10 Gy Irradiation treatment (IR), and untreated cells (−) were stained with γH2AX (red) and with DAPI (blue). Scale bar, 50 μm. This experiment was independently repeated three times with similar results. (b-d) Western blotting of p53 and p21. This experiment was independently repeated three times with similar results. (b and c) HCA2 cells were treated as in Fig. 3f with or without (b) ATM inhibitor KU-55944 (10 μM) or (c) DNA-PK inhibitor (10 μM). (d) Cells expressing doxycycline-inducible control shRNA (shControl) or p53 shRNA (shp53) with doxycycline (1 μg/ml) were treated with 0.01% SDS for 24 hours. After SDS wash away, cells lysates prepared at the indicated times were subjected to immunoblotting using the antibodies indicated. (e) SA-β-gal positive cells were counted on 6 days after SDS wash away. n = 200 cells examined over 3 biologically independent experiments. Data are shown as Mean(SD). P value: **<0.01, exact value: 0.0056, by 2-tailed unpaired Student’s t-test. (f) Representative images of DAPI penetration upon 0.008% SDS treatment (SDS) and 250 nM DXR for 24 hr. WI-38 cells were cultured in DAPI-containing medium with or without 0.008% SDS or 250 nM DXR. Scale bar, 20 μm. (g) A representative data set of DAPI penetration assay. DAPI positive cells were counted at indicated time points. Cell number: Control (n = 248), SDS (n = 166), DXR (n = 210). ****; p < 0.0001, Ctl vs. SDS: <0.0001, Ctl vs. DXR: 0.1928, by one-way ANOVA. ns: not significant. Scale bar, 100 μm. Data are shown as Mean(SEM)

