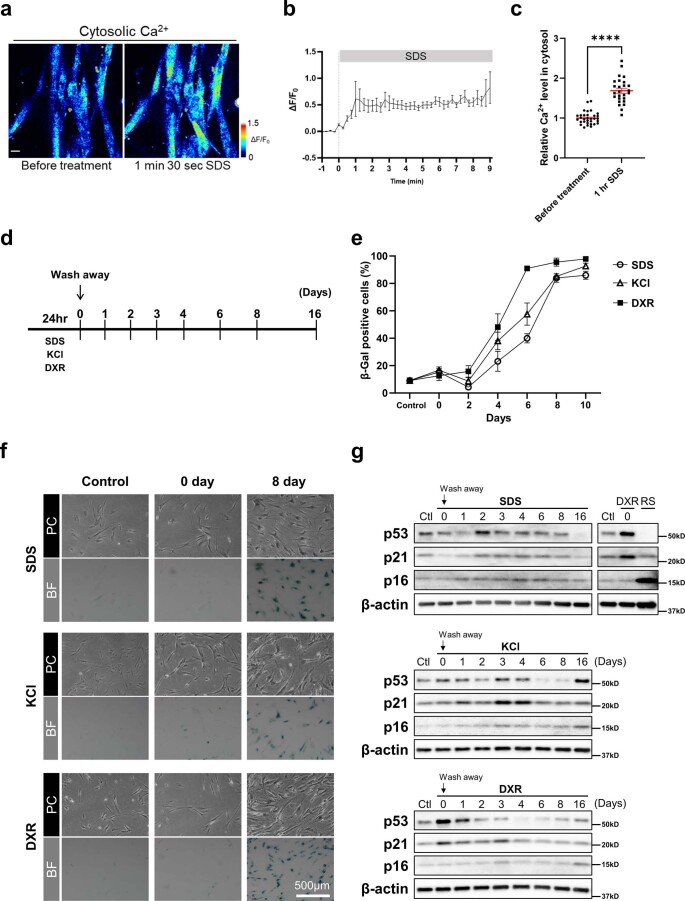
Extended Data Fig. 8. Cytosolic Ca2+ levels are increased after SDS treatment and Plasma membrane damage and Ca2+-influx induce cellular senescence.
(a) Representative ratiometric images of cytosolic Ca2+ (Cal Red R525/650) in WI-38 cells before or 1.5 min after addition of 0.0095% SDS. Fluorescence intensity was shown as a rainbow pseudocolor. Scale bar, 20 μm. (b) Cal Red R525/650 signals in WI-38 cells after addition of 0.0095%. n = 8. (c) Relative cytosolic Ca2+ levels in cells treated with 0.0095% SDS for one hour (n = 26 cells) compared with untreated cells (n = 32 cells) over 3 independent experiments. P value: ****<0.0001, by 2-tailed unpaired Student’s t-test. Mean(SEM). (d) The experimental design. (e and f) SA-β-gal positive cells were detected using WI-38 cells treated with 0.008% SDS, 75 mM KCl, and 250 nM DXR for 24 hours. The cells were washed and stained at the indicated time points. PC, Phase Contrast. Scale bar, 500 μm. n > 80 cells. The precise cell numbers are shown in Statistical Source Data file. 3 biological replicates. Mean(SD) is shown. (g) Western blotting using cell lysates of the WI-38 cells used in (e) and (f). This experiment was independently repeated three times with similar results.

