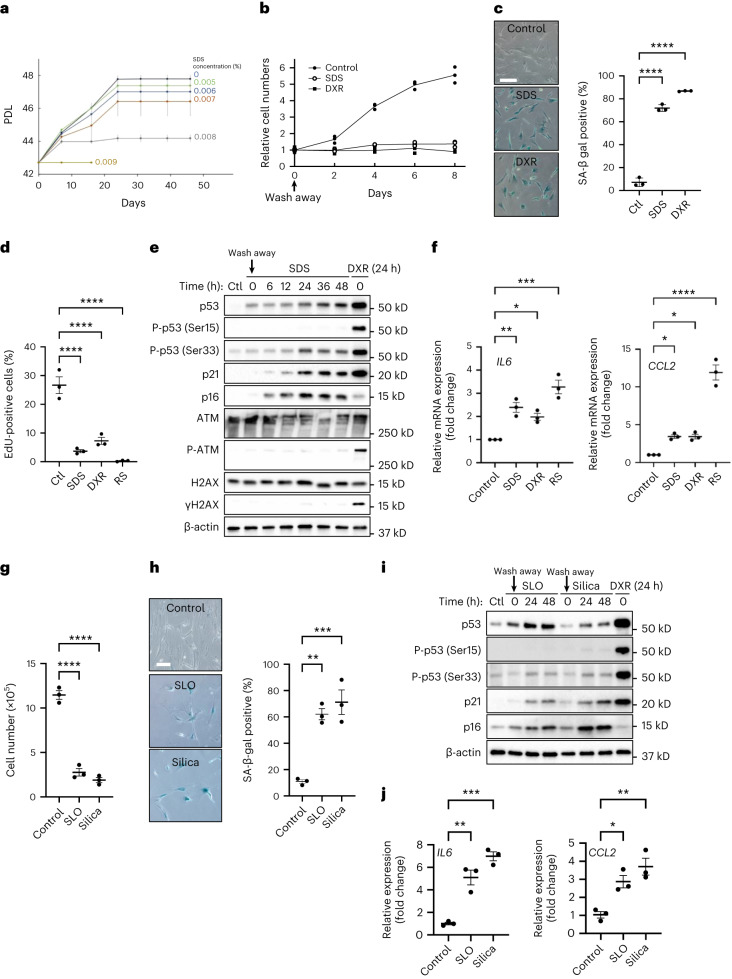
Fig. 3. Transient PMD induces premature senescence in normal human fibroblasts.
a, PDLs of WI-38 cells. WI-38 cells were cultured continuously in the medium containing SDS (0.005–0.009%, indicated on the right). b–f, WI-38 cells were incubated with 0.007% SDS or 250 nM DXR for 24 h, washed and released into fresh medium. b, Relative cell numbers are indicated. c, SA-β-gal-positive cells were detected using the cells 10 d after wash away. Scale bar, 200 μm. n > 100 cells. ****P < 0.001: control (Ctl) versus SDS: <0.0001 and Ctl versus DXR: <0.0001, by one-way ANOVA with Dunnettʼs test. d, WI-38 young cells (Ctl) and senescent cells (SDS, DXR and RS) were labeled with 10 μM EdU for 24 h. EdU–Alexa Fluor 647 signals and Hoechst 33342 signals were obtained, and the ratio of EdU-incorporated cells was calculated. n > 200 cells. ****P < 0.001: Ctl versus SDS: <0.0001; Ctl versus DXR: <0.0001; Ctl versus RS: <0.0001, by one-way ANOVA with Dunnettʼs test. e, Western blotting using the cell lysates of WI-38 cells treated with SDS or DXR. The cells after 24-h treatment were collected at the indicated times after wash away. f, qPCR analysis of SASP genes (IL6 and CCL2) in senescent WI-38 cells. RNA was isolated from WI-38 untreated cells (Ctl), 5 d after SDS or DXR wash away and RS. *P <0.05, **P < 0.01 and ***P < 0.001, by one-way ANOVA with Dunnettʼs test. Exact P value: IL6_Control versus SDS: 0.0045, IL6_Control versus DXR: 0.0309, IL6_Control versus RS: 0.0002, CCL2_Control versus SDS: 0.0318, CCL2_Control versus DXR: 0.033, CCL2_Control versus RS: <0.0001. g–j, WI-38 cells were incubated with 200 ng ml−1 SLO, 125 μg ml−1 silica (diameter, 0.8 μm) (Silica) or 250 nM DXR for 24 h, washed and released into fresh medium. g, Cell number was counted 10 d after wash away. ****P < 0.001: Ctl versus SLO: <0.0001 and Ctl versus Silica: <0.0001, by one-way ANOVA with Dunnettʼs test. h, SA-β-gal-positive cells were detected 10 d after wash away. Scale bar, 50 μm. Graphs show quantification of SA-β-gal-positive cells (n > 100 cells). **P < 0.01 and ***P < 0.005: Ctl versus SLO: 0.0022 and Ctl versus Silica: 0.0009, by one-way ANOVA with Dunnettʼs test. i, Western blotting using the cell lysates of WI-38 cells treated with SLO or Silica for 24 h. Cells were collected at the indicated times after wash away. j, qPCR analysis of IL6 and CCL2 gene expression. RNA was isolated 5 d after wash away. *P < 0.05, **P < 0.01 and ***P < 0.001, by one-way ANOVA with Dunnettʼs test. Exact P value: IL6_Control versus SLO: 0.0012, IL6_Control versus Silica: 0.0001, CCL2_Control versus SLO: 0.0179 and CCL2_Control versus Silica: 0.0031. Data in c, d and f–j are presented as mean (horizontal bars) ± s.d. (whiskers) of at least three biological replicates.

