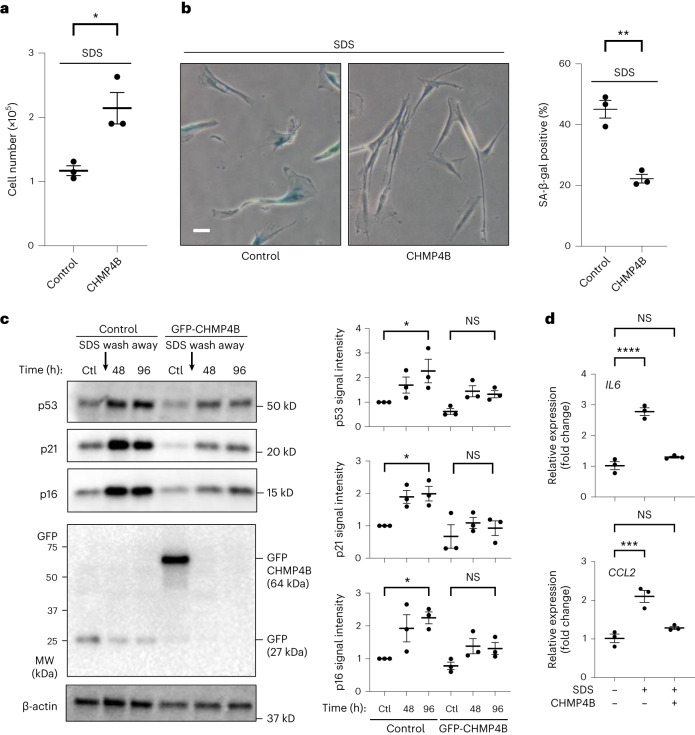
Fig. 4. Transient overexpression of ESCRT-III (CHMP4B) suppressed PMD-dependent senescence.
a–d, A control plasmid (GFP) or a plasmid encoding ESCRT-III (GFP-CHMP4B) was overexpressed in WI-38 cells. The cells were treated with 0.007% SDS for 24 h, washed and released into fresh medium. a, Cell number in a 6-cm-diameter dish was counted 10 d after SDS wash away. *P < 0.05, exact value: 0.0468, by two-tailed unpaired Student’s t-test. b, SA-β-gal-positive cells were detected 7 d after SDS wash away. Scale bar, 50 μm. Graphs show quantification of SA-β-gal-positive cells (n > 100 cells). **P < 0.01, exact value: 0.0067, by two-tailed unpaired Student’s t-test. c, Western blotting using the cell lysates of WI-38 cells treated with SDS for 24 h that were collected at the indicated times after wash away. GFP (control) and GFP-CHMP4B expression was confirmed by anti-GFP blot. Relative signal intensities are quantified. *P < 0.05, by one-way ANOVA with Dunnettʼs test. Exact P value: p53_Ctl versus 96 h in control (Ctl) cells: 0.0491; p53_Ctl versus 96 h in CHMP4B-expressed cells: 0.4648; p21_Ctl versus 96 h in Ctl cells: 0.0477; p21_Ctl versus 96 h in CHMP4B-expressed cells: 0.5864; p16_Ctl versus 96 h in Ctl cells: 0.0195; p16_Ctl versus 96 h in CHMP4B-expressed cells: 0.5793. d, qPCR analysis of IL6 and CCL2 gene expressions. RNA was isolated 5 d after wash away. ***P < 0.005 and ****P < 0.001, by one-way ANOVA with Dunnettʼs test. Exact P value: IL6_Ctl versus SDS in Ctl cells: <0.0001; IL6_Ctl versus SDS in CHMP4B-expressed cells: 0.1843; CCL2_Ctl versus SDS in Ctl cells: <0.0009; CCL2_Ctl versus SDS in CHMP4B-expressed cells: 0.2306. Data in a–d are presented as mean (horizontal bars) ± s.d. (whiskers) of three biological replicates. NS, not significant.

