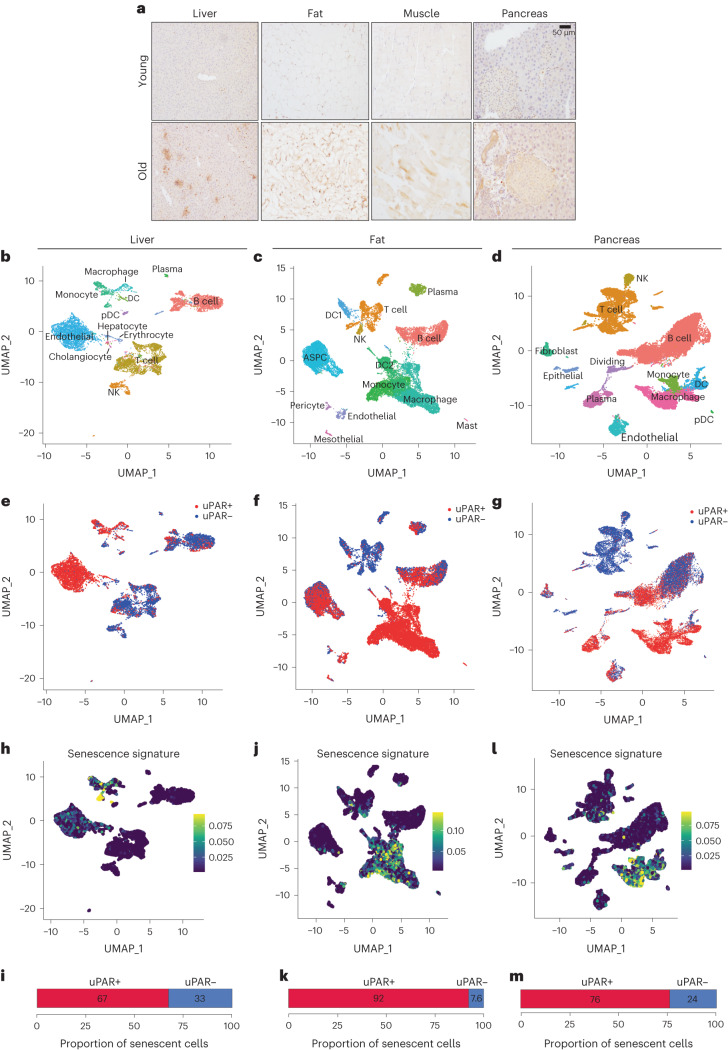
Fig. 1. uPAR is upregulated on senescent cells in physiological aging.
a, Immunohistochemical staining of mouse uPAR in liver, adipose tissue, muscle and pancreas from young (age 3 months) or old (age 20 months) mice (n = 3 per age). b–m, Single-cell analysis of uPAR expression and senescence. uPAR-positive and uPAR-negative cells were sorted from the liver, adipose tissue and pancreas of 20-month-old mice and subjected to single-cell RNA-seq by 10x chromium protocol (n = the sequencing of four mice where two females were combined into one replicate and two males were combined into another replicate). b, Uniform manifold approximation and projection (UMAP) visualization of liver cell types. c, UMAP visualization of adipose tissue cell types. d, UMAP visualization of pancreas cell types. e, UMAP visualization of hepatic uPAR-negative and uPAR-positive cell types. f, UMAP visualization of adipose uPAR-negative and uPAR-positive cell types. g, UMAP visualization of pancreatic uPAR-negative and uPAR-positive cell types. h,j,l, UMAP visualizations with senescence signature scores24 in each cell indicated by the color scale. i,k,m, Quantification of the proportion of uPAR-positive and uPAR-negative cells contributing to the respective senescence signature. h,i, Liver; j,k, adipose tissue; l,m, pancreas. Results are from one independent experiment (a–m). DC, dendritic cell; NK, natural killer; pDC, plasmacytoid dendritic cell; ASPC, adipose progenitor and stem cells.

