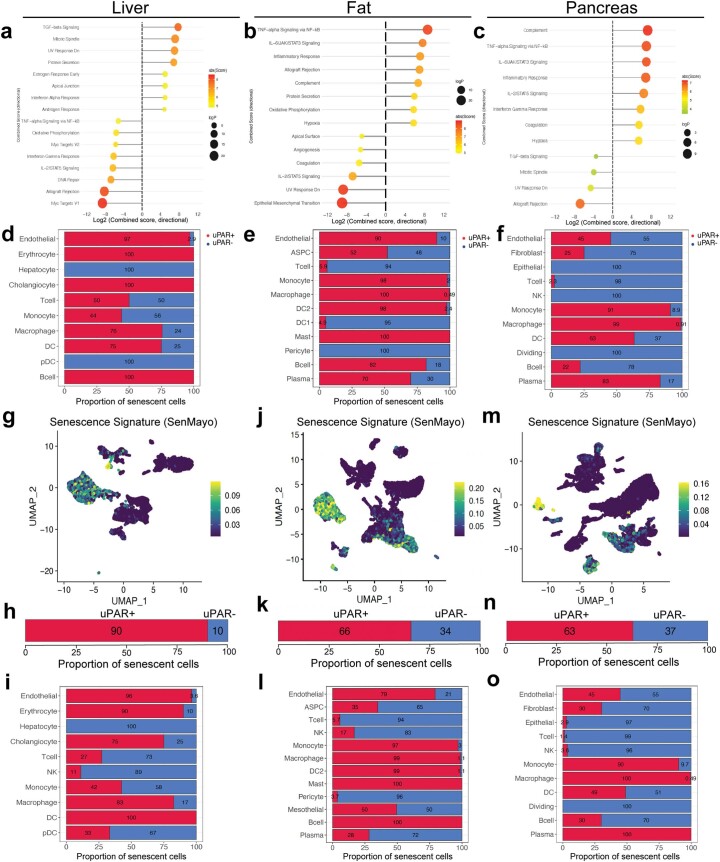
Extended Data Fig. 3. Characteristics of senescent uPAR-positive cells in aged tissues.
a-c, Molecular Signature Database Hallmark 2020 signatures that are significantly enriched in uPAR positive cells vs uPAR negative cells of liver (a), adipose tissue (b) and pancreas (c). d-f, quantification of the proportion of uPAR positive and negative cells by cell type contributing to the respective senescence signature in Fig. 1h(d), Fig. 1j(e) and Fig. 1l(f). g–o, UMAP visualizations with senescence signature scores17 in each cell indicated by the color scale. Below: quantification of the proportion of uPAR positive and negative cells contributing to the respective senescence signature in total (h,k,n) and by cell type (i,l,o). g,h,i, liver; j,k,l, adipose tissue; m,n,o; pancreas. Results are from 1 independent experiment with (n = the sequencing of 4 mice where 2 females were combined into one replicate and 2 males were combined into another replicate) (a-m).

