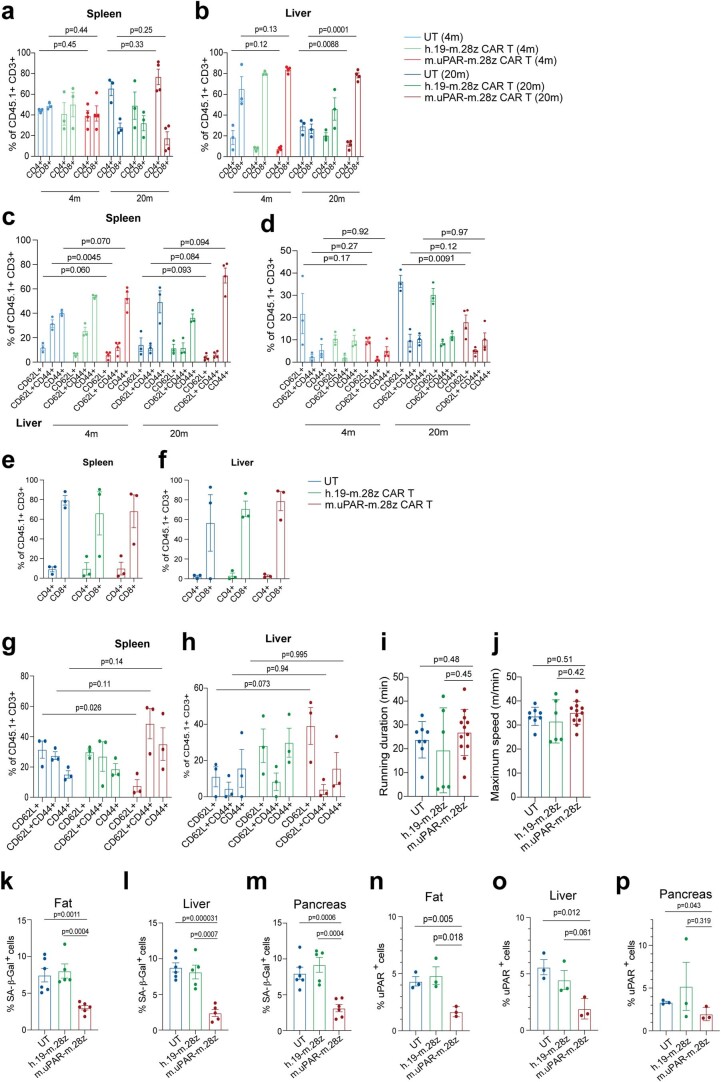
Extended Data Fig. 7. Profile of and long-term effects of uPAR CAR T cells in aging.
a,b, Percentage of CD4+ or CD8+ cells among CD45.1+ T cells from the spleen (a) or liver (b) of 4-month-old or 20-month-old mice 20 days after cell infusion (n = 3 mice per age group for untransduced T cells [UT] and for h.19-m.28z; n = 4 for m.uPAR-m.28z). c,d, Percentage of CD45.1+ T cells expressing differentiation markers CD62L and CD44 in the spleen (c) or liver (d) of 4-month-old or 20-month-old mice 20 days after cell infusion (sample sizes as in a). e,f, Percentage of CD4+ or CD8+ cells among CD45.1+ T cells in the spleen (e) or liver (f) of 15-month-old mice 12 months after cell infusion (n = 3 mice per group). g,h, Percentage of CD45.1+ T cells expressing differentiation markers CD62L and CD44 on CD45.1+ T cells in the spleen (g) or liver (h) of 15-month-old mice 12 months after cell infusion (n = 3 mice per group). i, Time to exhaustion in exercise capacity testing 12 months after cell infusion (n = 8 for untransduced T cells; n = 6 for h.19-m.28z; n = 12 for m.uPAR-m.28z). j, Maximum speed (m/min) in capacity testing 12 months after cell infusion (sample sizes as in i). k-m, Quantification of SA-β-Gal–positive cells 12 months after cell infusion in (k) adipose tissue (n = 6 for UT; n = 5 for h.19-m.28z; n = 6 for m.uPAR-m.28z); (l) liver (n = 6 for UT; n = 5 for h.19-m.28z; n = 5 for m.uPAR-m.28z) and (m) pancreas (n = 6 for UT; n = 5 for h.19-m.28z; n = 6 for m.uPAR-m.28z). n-p, Quantification of uPAR-positive cells in (n) adipose tissue, (o) liver and (p) pancreas 12 months after cell infusion (n = 3 per group). Results of 1 independent experiment (a-h, n-p) or 2 independent experiments (i-m). Data are mean ± s.e.m.; p values from two-tailed unpaired Student’s t-test (a-h, k-p) or two-tailed Mann Whitney test (i,j).

