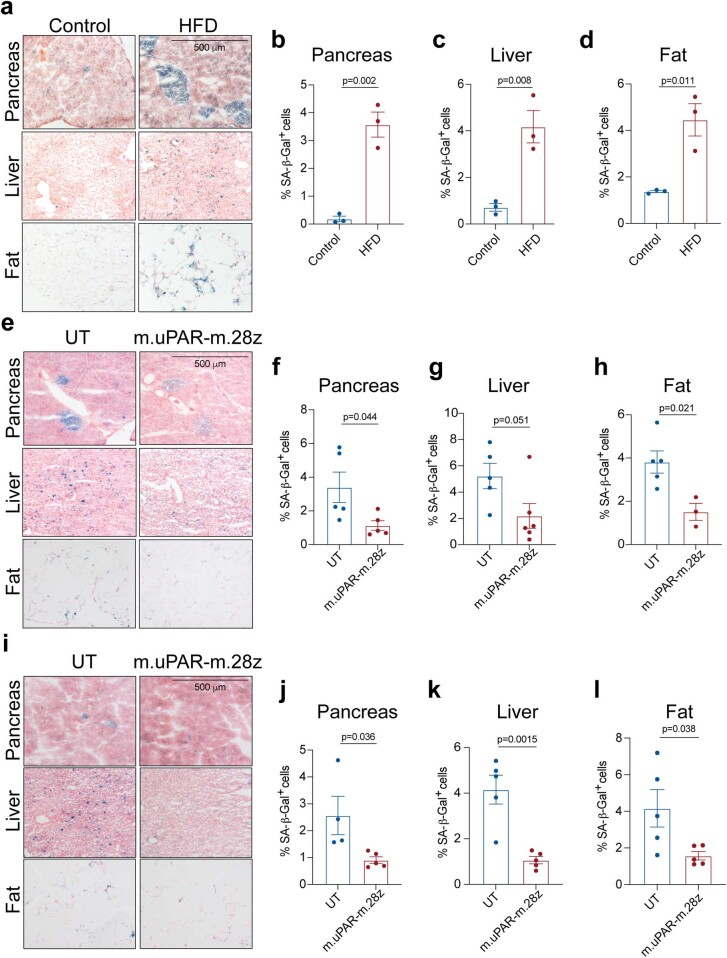
Extended Data Fig. 8. uPAR CAR T cells decrease senescent cell burden in therapeutic and preventive settings in high fat diet.
a, Representative staining of SA-β-Gal after two months of high fat diet or normal chow diet. b-d; Quantification of SA-β-Gal–positive cells in pancreas, liver and adipose tissue after two months of high fat diet or normal chow diet (n = 3 for chow; n = 3 HFD). e, Representative staining of SA-β-Gal 1 month after cell infusion in the experimental scheme depicted in Fig. 7a. f-h; Quantification of SA-β-Gal–positive cells in pancreas, liver and adipose tissue 1 month after cell infusion (n = 5 for UT; for m.uPAR-m.28z n = 5 in pancreas, n = 6 in liver and n = 3 in adipose tissue). UT, untransduced T cells. i, Representative staining of SA-β-Gal 3.5 months after cell infusion in the experimental scheme depicted in Fig. 7j. j-l, Quantification of SA-β-Gal–positive cells in pancreas, liver, and adipose tissue 3.5 months after cell infusion (UT n = 4 in pancreas, n = 5 in liver and adipose tissue; for m.uPAR-m.28z n = 5). Each panel shows results from 1 experiment. Data are mean ± s.e.m.; p values from two-tailed unpaired Student’s t-test (b-d; f-h; j-l).

