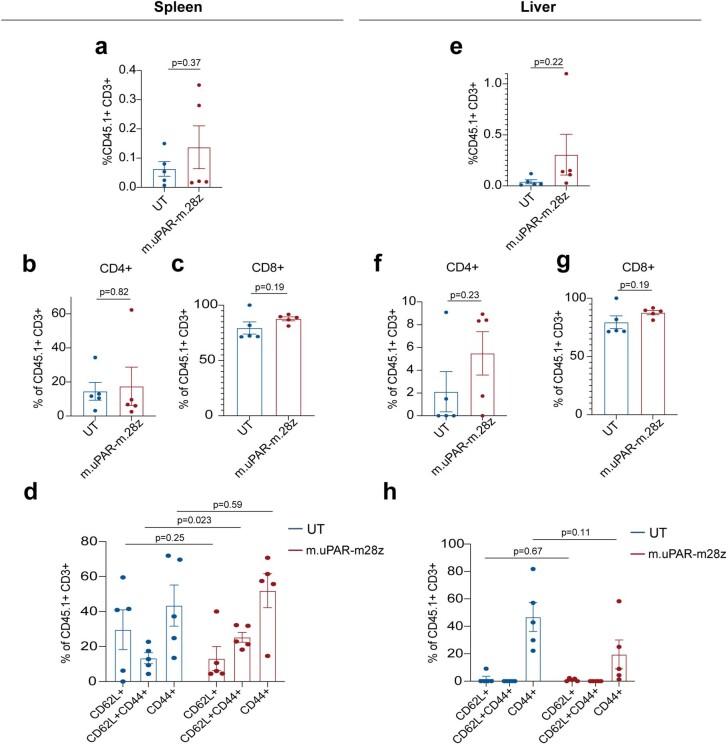
Extended Data Fig. 9. Profile and persistence of uPAR CAR T cells in metabolic syndrome.
T cells were assessed in spleen (a-d) and liver (e-h) 3.5 months after cell infusion in the experimental scheme depicted in Fig. 7j. a, Percentage of CD45.1+ T cells in the spleen. b, Percentage of CD4+ cells among CD45.1+ T cells in the spleen. c, Percentage of CD8+ cells among CD45.1+ T cells in the spleen. d, Percentage of CD45.1+ T cells from the spleen expressing differentiation markers CD62L and CD44. e, Percentage of CD45.1+ T cells in the liver. f, Percentage of CD4+ cells among CD45.1+ T cells in the liver. g, Percentage of CD8+ cells among CD45.1+ T cells in the liver. h, Percentage of CD45.1+ T cells in the liver expressing differentiation markers CD62L and CD44. Results in each panel are from 1 experiment (n = 5 mice per group). Data are mean ± s.e.m.; p values from two-tailed unpaired Student’s t-test.

