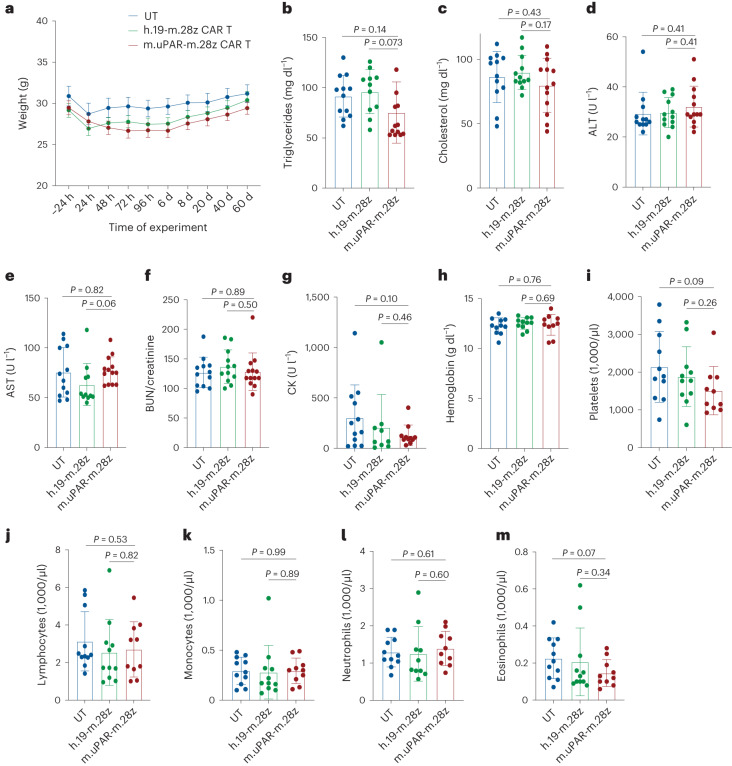
Fig. 4. Safety of uPAR CAR T cells in aged mice.
Mice were treated with m.uPAR-m.28z CAR T cells, h.19-m.28z CAR T cells or UT cells as schematized in Fig. 3a. a, Body weight 24 h before and at various times after cell infusion (n = 12 mice for UT; n = 11 for h.19-m.28z; n = 12 for m.uPAR-m.28z). b, Triglyceride levels 20 d after cell infusion (n = 12 mice for UT; n = 11 for h.19-m.28z; n = 13 for m.uPAR-m.28z). c, Cholesterol levels 20 d after cell infusion (n = 12 for UT and for h.19-m.28z; n = 13 for m.uPAR-m.28z). d, Alanine transaminase (ALT) levels 20 d after cell infusion (sample sizes as in c). e, Aspartate aminotransferase (AST) levels 20 d after cell infusion (n = 12 for UT; n = 11 for h.19-m.28z; n = 13 for m.uPAR-m.28z). f, BUN/creatinine ratio 20 d after cell infusion (sample sizes as in c). g, Creatine kinase (CK) 20 d after cell infusion (n = 12 for UT; n = 9 for h.19-m.28z; n = 11 for m.uPAR-m.28z). h, Hemoglobin levels 20 d after cell infusion (n = 11 for UT; n = 11 for h.19-m.28z; n = 10 for m.uPAR-m.28z). i, Platelet numbers 20 d after cell infusion (n = 11 for UT; n = 11 for h.19-m.28z; n = 10 for m.uPAR-m.28z). j, Lymphocyte numbers 20 d after cell infusion (n = 11 for UT; n = 11 for h.19-m.28z; n = 10 for m.uPAR-m.28z). k, Monocyte numbers 20 d after cell infusion (n = 11 for UT; n = 11 for h.19-m.28z; n = 10 for m.uPAR-m.28z). l, Neutrophil numbers 20 d after cell infusion (n = 11 for UT; n = 10 for h.19-m.28z; n = 10 for m.uPAR-m.28z). m, Eosinophil numbers 20 d after cell infusion (n = 11 for UT; n = 11 for h.19-m.28z; n = 10 for m.uPAR-m.28z). Results are from two independent experiments. Data are the mean ± s.e.m.; P values from two-tailed unpaired Student’s t-test (b–m).

