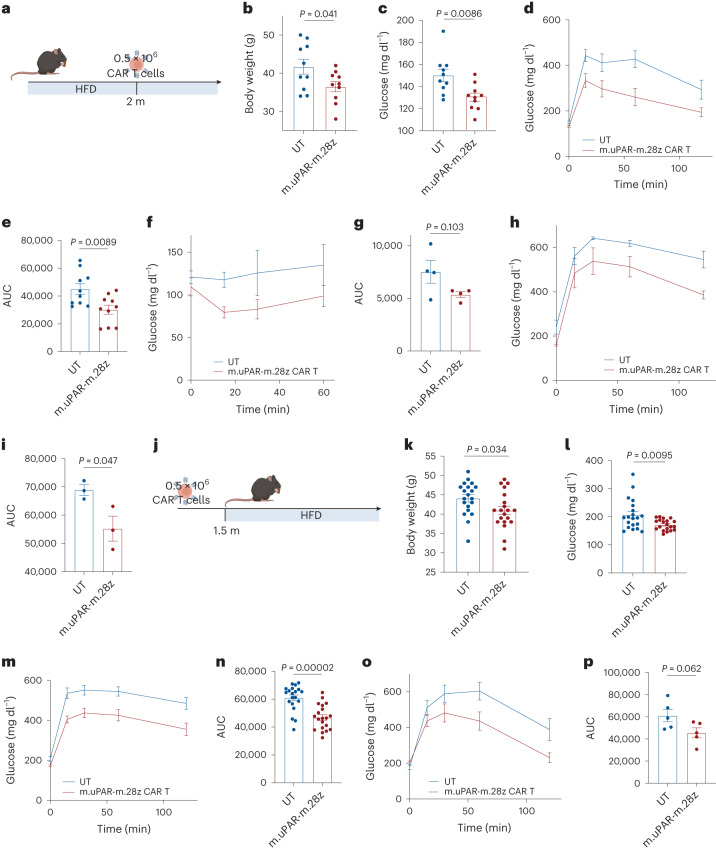
Fig. 7. uPAR CAR T cells are therapeutic and preventive in metabolic syndrome.
a, Experimental scheme for b–i. Three-month-old C57BL/6N mice were treated with an HFD for 2 months followed by intravenous infusion with 0.5 × 10⁶ m.uPAR-m.28z or UT cells 16 h after administration of cyclophosphamide (200 mg per kg body weight). Mice were euthanized 1 month later or monitored over time. b, Body weight 1 month after cell infusion (n = 10 mice per group). c, Basal glucose levels after starvation at 1 month after cell infusion (n = 10 mice per group). d, Glucose levels before (0 min) and after intraperitoneal administration of glucose (1 g per kg body weight) 1 month after cell infusion (n = 10 mice per group). e, AUC representing the results from d. f, Glucose levels before (0 min) and after intraperitoneal administration of insulin (0.5 units per kg body weight) 1 month after cell infusion (n = 4 mice per group). g, AUC representing the results from f. Each point represents a single mouse. h, Glucose levels before (0 min) and after intraperitoneal glucose administration (1 g per kg body weight) 2.5 months after cell infusion (n = 3 mice per group). i, AUC representing the results from h. Each point represents a single mouse. j, Experimental scheme for k–p. Three-month-old C57BL/6N mice were intravenously infused with 0.5 × 10⁶ m.uPAR-m.28z or UT cells 16 h after administration of cyclophosphamide (200 mg per kg body weight). At 1.5 months after infusion, mice were placed on an HFD, then euthanized 2 months later or monitored over time. k, Body weight at 3.5 months after cell infusion (n = 20 mice per group). l, Basal glucose levels after starvation 3.5 months after cell infusion (n = 20 mice per group). m, Levels of glucose before (0 min) and after intraperitoneal administration of glucose (1 g per kg body weight) 1 month after cell infusion (n = 20 mice per group). n, AUC representing the results from m. o, Glucose levels before (0 min) and after intraperitoneal glucose administration (1 g per kg body weight) 5.5 months after cell infusion (n = 5 mice per group). p, AUC representing the results from o. Each point represents a single mouse (a–p). Results are from two independent experiments (b–e and k–n) or one independent experiment (f–i, o and p). Data are the mean ± s.e.m.; P values derived from two-tailed unpaired Student’s t-test (b, c, e, g, i, k, l, n and p). Schematics were created with BioRender.com.

