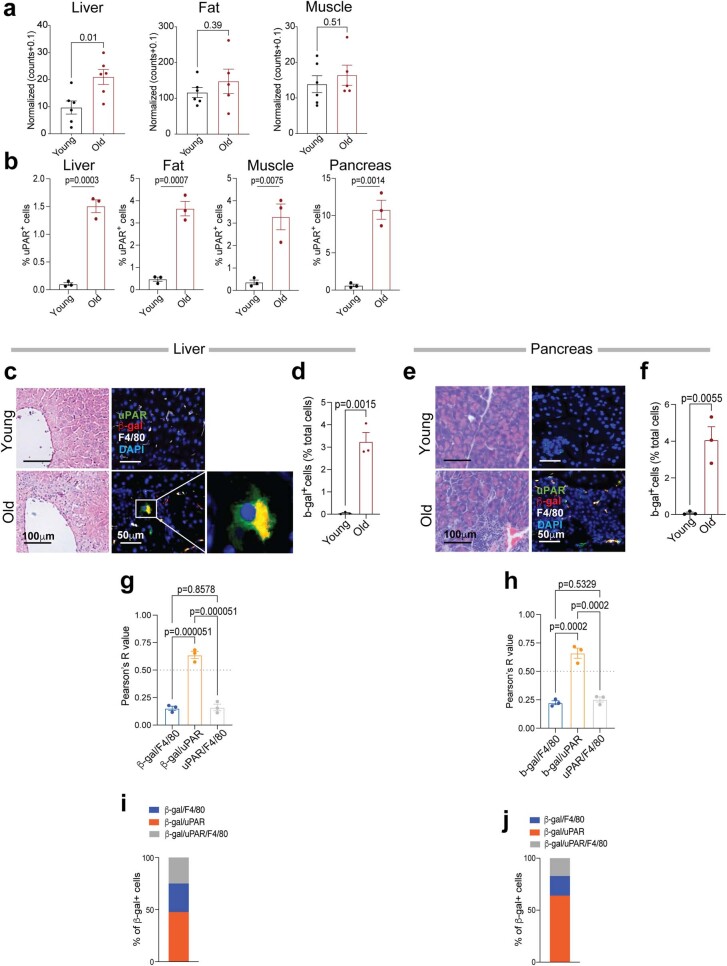
Extended Data Fig. 1. Characterization of uPAR-positive cells in aging.
a, RNA expression of Plaur in liver, adipose tissue (fat) and muscle of young (3 months) or old (21 months) mice. Data obtained from the Tabula Muris Senis project18. b, Quantification of immunohistochemical staining of mouse uPAR in liver, adipose tissue, muscle and pancreas from young (age 3 months) or old (age 20 months) mice (n = 3 per age). c, Hematoxylin and eosin staining and immunofluorescence staining of young (age 3 months n = 3 mice) or old (age 18–20 months n = 3 mice) livers. uPAR (green), β-gal (red), F4/80 (white), DAPI (blue). d, Percentage of SA-b-gal positive cells in young and aged livers in c. e, Hematoxylin and eosin staining and immunofluorescence staining of young (age 3 months n = 3 mice) or old (age 18–20 months n = 3 mice) pancreas. uPAR (green), β-gal (red), F4/80 (white), DAPI (blue). f, Percentage of SA-b-gal positive cells in young and aged livers in e. g,h, Correlation (Pearson’s R value) of β-gal and F4/80 co-staining, β-gal and uPAR co-staining or uPAR and F4/80 co-staining in aged livers (g) and aged pancreas (h). i,j, Percentage of β-gal positive cells that costain for F4/80, uPAR or uPAR and F4/80 in aged livers (i) and aged pancreas (j). Data are mean ± s.e.m (a,b,d,f-h); values are derived from two-tailed unpaired Student’s t-tests (a,b,d,f) one-way ANOVA with multiple comparisons (g,h). Results are from 1 independent experiment (a-j).

