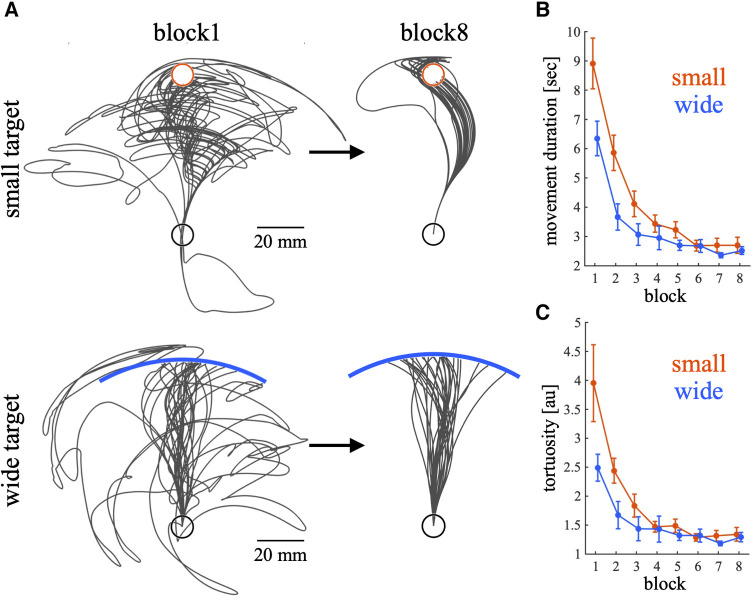
Figure 2.
Raw cursor trajectories in blocks 1 and 8, movement duration and tortuosity during the training phase. (A) The trajectories of the cursor are illustrated with black lines for two representative participants from small and wide target groups, respectively. Trajectories for both block 1 and block 8 are represented the same participant. The targets for each group are indicated differently: a red circle represents the small target, and a blue bar denotes the wide target. (B,C) Movement duration (B) and tortuosity (C) across trials. Thick lines indicate the mean across participants. The error bars indicate the mean ± standard error across participants. The red and blue lines represent the small and wide target conditions, respectively. When creating figures, data exceeding the 95th percentile (movement duration: 11.185 s; tortuosity: 4.447) were excluded.

