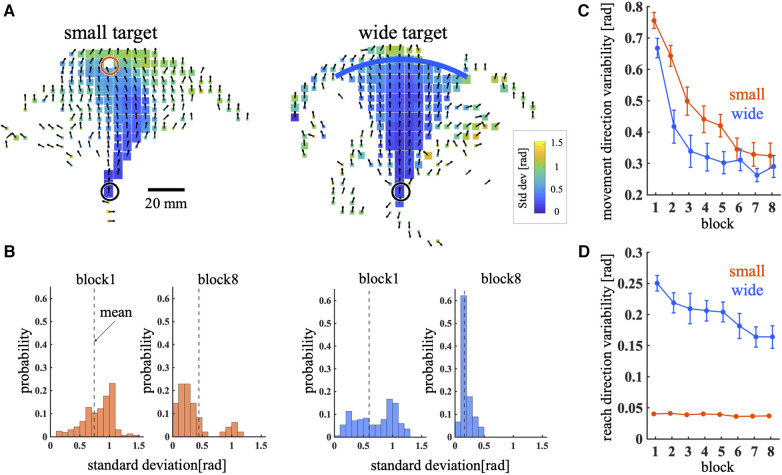
Figure 3.
Movement direction variability and reach direction variability. (A) Mean and standard deviation of the movement direction across all trajectories during the training phase. The direction of the arrow and color of the bin represent the mean and standard deviation of the movement direction, respectively. The bin size represents the number of times the cursor passes through the bin. (B) Histogram of the standard deviations of all bins. The dashed line represents the mean across all bins weighted by the number of visits to each bin. (C,D) MV (C) and RV (D) across blocks. Thick lines indicate the mean across participants. Error bars indicate mean ± standard error across participants. The red and blue lines represent the small and wide target conditions, respectively.

