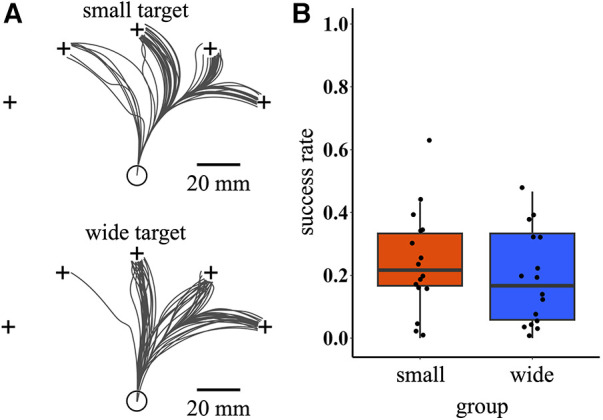
Figure 4.

Raw success trajectories and success rate during the test phase. (A) Cursor trajectories of all successful trials during the test phase for two representative participants selected from small and wide target conditions, respectively. The black lines indicate cursor trajectories. (B) Boxplot of success rate in the first block of the test phase. The circular dots indicate the success rate of each participant.
