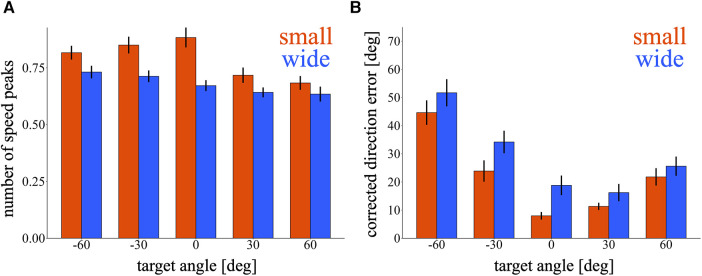
Figure 5.
Corrective movements during the test phase. (A,B) Bar graph of the number of speed peaks (A) and corrected direction error (B) in the first block of the test phase. The red and blue bars represent the small and wide target conditions, respectively. Error bars indicate mean ± standard error across participants.

