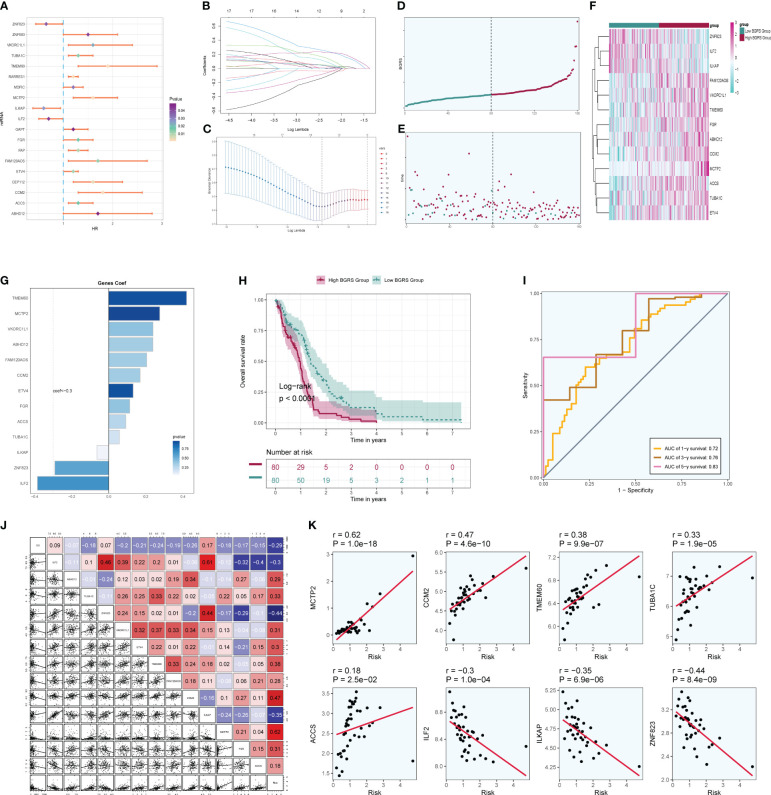
Figure 10.
Independent prognostic analysis. (A) A total of 19 prognosis-related differential genes. (B) LASSO analysis coefficient spectrum distribution of 13 prognostic genes. (C) Optimal cross-validation of parameter selection in LASSO regression. (D) Categorization of patients into high- and low-risk groups based on risk scores. (E) Distribution of patients in high- and low-risk groups. (F) Heatmap of the distribution of prognostic-related genes. (G) Coef values of prognostic-related genes. (H) High- and low-risk groups’ Kaplan–Meier prognostic analysis curves. (I) Time-related ROC curves with area under the curves (AUCs) of 0.72, 0.76, and 0.83 at 1, 3, and 5 years. (J) Correlation analysis between genes and risk scores and OS. (K) Dot plots of the top eight prognostic genes that had a strong correlation with risk scores.

