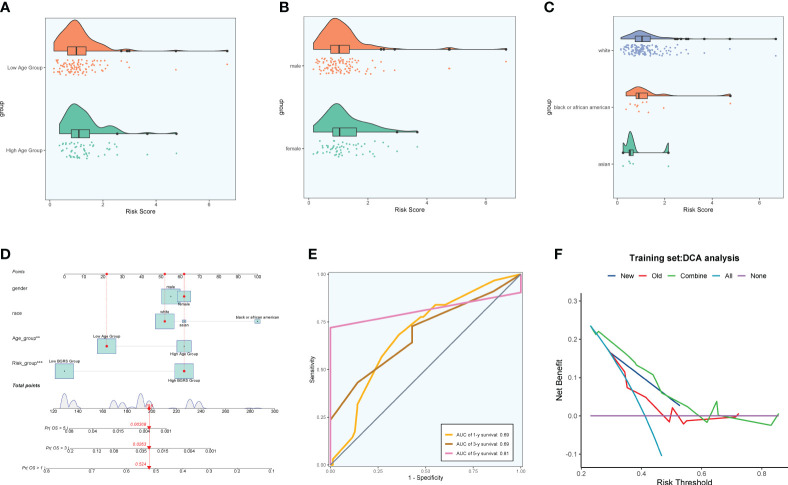
Figure 11.
Clinical correlation analysis. (A–C) Analysis of the correlation between risk scores and age, gender, and ethnicity factors. (D) Survival column line plots of GBM patients at 1, 3, and 5 years. (E) Time-dependent ROC plots, with AUCs of 0.69, 0.69, and 0.81 at 1, 3, and 5 years, respectively. (F) DCA of prognostic models.

