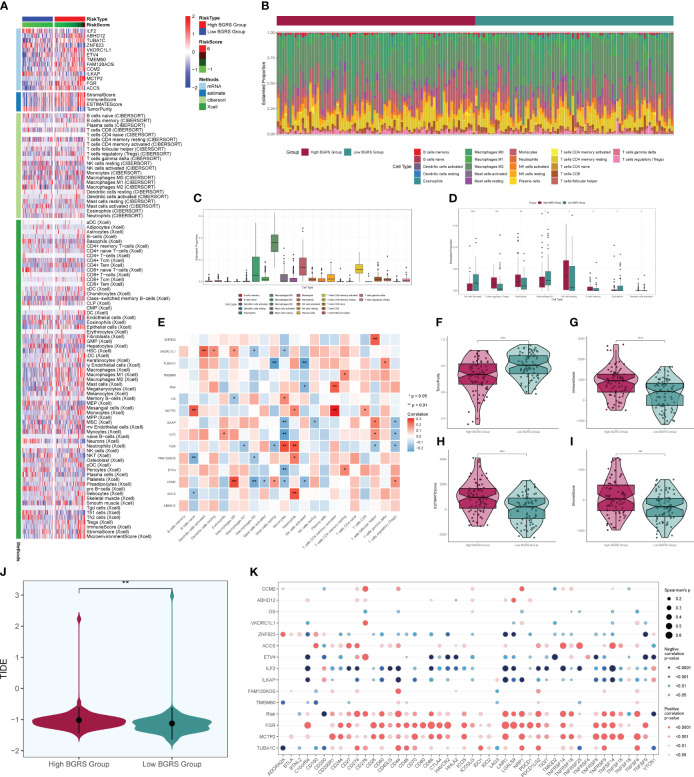
Figure 12.
Immune correlation analysis. Heatmap of prognostic genes, tumor microenvironment, and immune cell situation in high- and low-risk groups. (B) Difference in immune cell ratio between high- and low-risk groups. (C) Difference in immune cell type scores. (D) Difference in immune cells between high- and low-risk groups. (E) Immunocell correlation with prognostic genes, risk scores, and OS. (F–I) Immune scores, stroma scores, tumor purity scores of tumor microenvironment of high- and low-risk groups, and the overall score difference plot. (J) TIDE score violin plot for high- and low-risk groups. (K) Degree of correlation between immune checkpoints and risk scores and prognostic genes. * means p < 0.05; ** means p < 0.01; *** means p < 0.001; **** means p < 0.0001.

