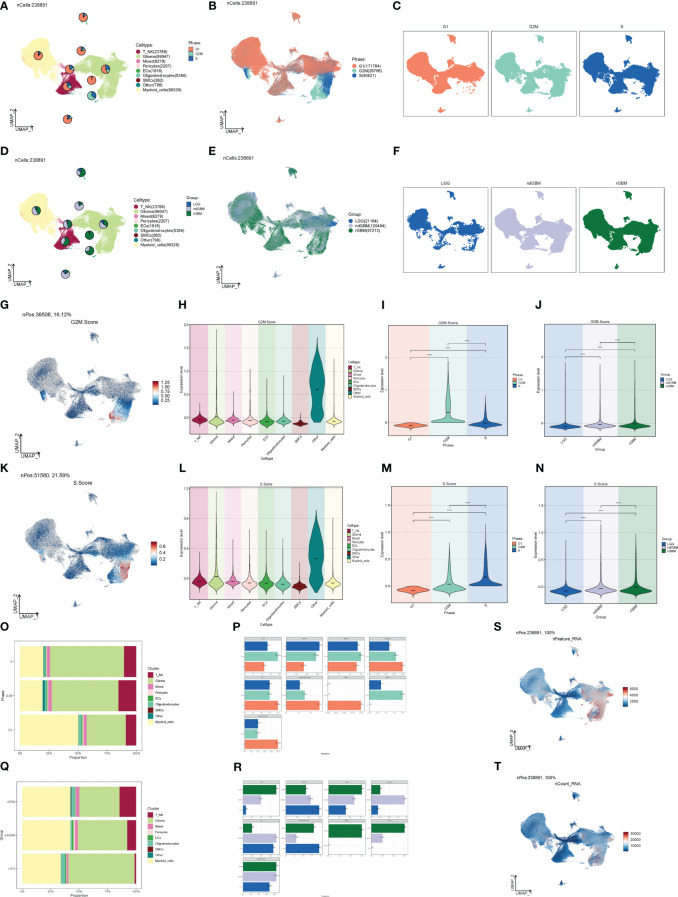
Figure 2.
Staging and clinical subtypes of large population cells. (A–C) Plots of the distribution of clinical subtypes LGG, ndGBM, and rGBM in major populations of GBM cells. (D–F) Plots of the distribution of cell staging G2M, S, and G1 in major populations of GBM cells. (G) Distribution of UNMP for the G2M.Score. (H–J) Plots of G2M.Score violin in major populations of GBM cells, cell staging, and clinical subtypes. (K) UNMP distribution maps. (L–N) S.Score violin maps of GBM large populations of cells, cell staging, and clinical subtypes. (O, P) Situation maps of the proportion of cells between GBM large populations of cells and the clinical subtypes LGG, ndGBM, and rGBM. (Q, R) Situation maps of the proportion of cells between GBM large populations of cells and the cell staging periods G2M, S, and G1. (S, T) nFeature and UNMP distribution plots for nCount.

