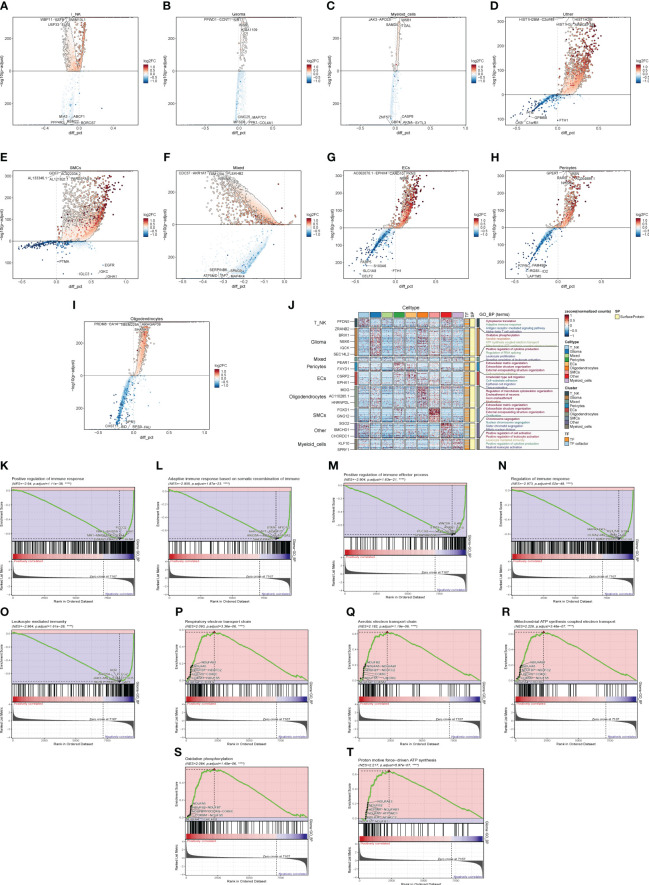
Figure 3.
Enrichment analysis of major clusters of cells. (A–I) Differential gene distribution map of GBM large population cells and other cells, in which the top five selected genes from each of the high-expression and low-expression genes are shown. (J) GO enrichment analysis map of GBM large population cells. (K–T) GSEA enrichment analysis map of Glioma, in which the top five pathways from each of the low-expression group and the high-expression group were selected.

