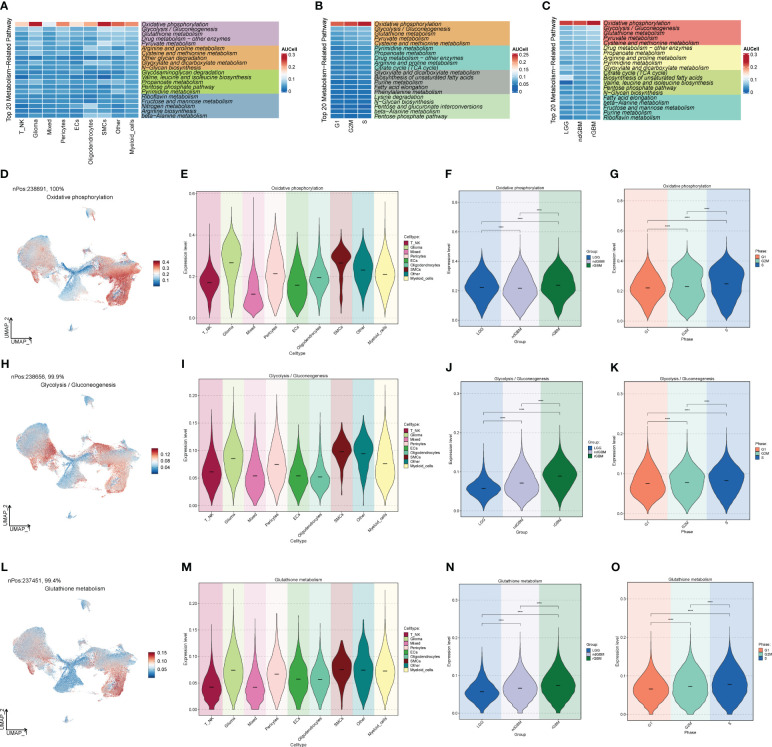
Figure 4.
Metabolic pathway map of GBM large population cells. (A) Top 20 metabolic pathways of GBM large population cells. (B) Top 20 metabolic pathways of G2M, S, and G1 staged cells. (C) Top 20 metabolic pathways of LGG, ndGBM, and rGBM clinical subtypes cells. (D–O) “Oxidative phosphorylation”, “Glycolysis/Gluconeogenesis”, and “Glutathione metabolism” pathways and the distribution of UNMP in the GBM cell population, cell staging, and clinical subtype scores. The distribution of UNMP in GBM cells, cell staging, and clinical subtype scores were plotted. **** means p < 0.0001.

