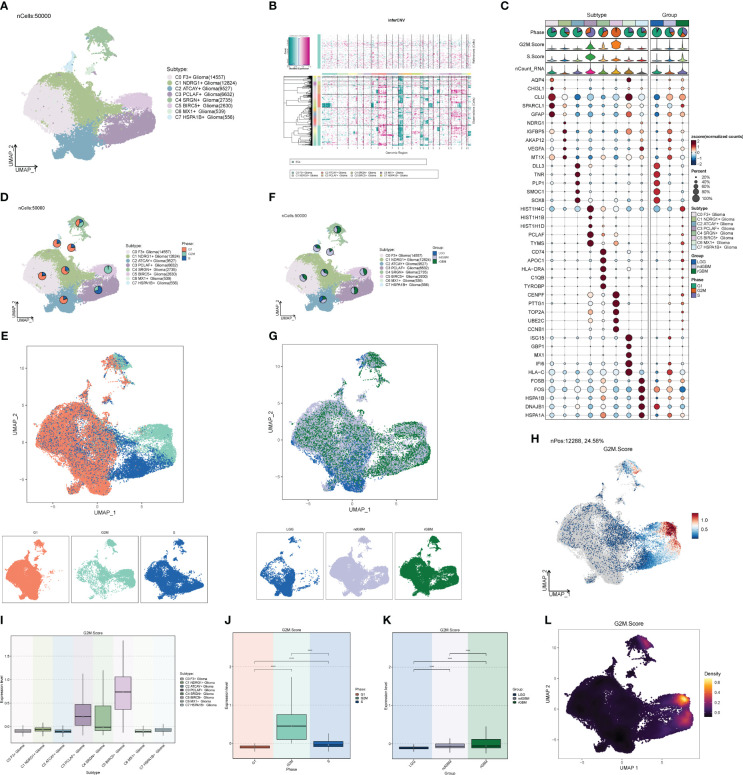
Figure 5.
Glioma cell subpopulation and correlation analysis. (A) UNMP distribution of cell subpopulations. (B) Heatmap of CNV status of cell subpopulations. (C) Expression of the top five marker genes in each subpopulation of cells. (D, E) UNMP distribution of subpopulation of cells in each clinical subtype of LGG, ndGBM, and rGBM. (F, G) UNMP distribution of subpopulation of cells in each cell staging of G2M, S, and G1. (H) UNMP distribution of score of G2M. (I–K) Box plot of G2M.Score for Glioma cell subpopulations, cell staging, and clinical subtypes. (L) Density plot of G2M.Score for Glioma subpopulation cells. **** means p < 0.0001.

