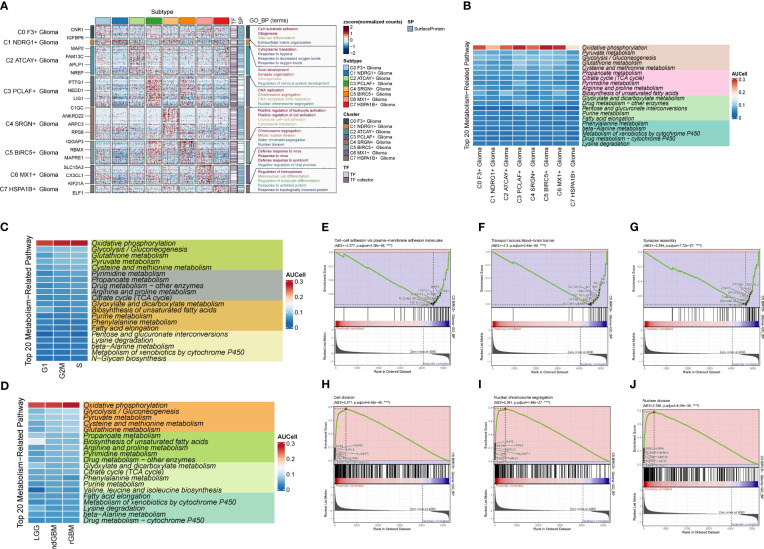
Figure 6.
Enrichment analysis and cell metabolism analysis of Glioma cell subpopulations. (A) GO enrichment analysis plot of Glioma cell subpopulations. (B) Top 20 metabolic pathway plots of Glioma cell subpopulations. (C) Top 20 metabolic pathway plots of cell subpopulations of each staging cell of G2M, S, and G1. (D) Top 20 metabolic pathway plots of cell subpopulations of each clinical subtype of LGG, ndGBM, and rGBM. (E–J) GSEA enrichment analysis plots of cells of subpopulation of C5, with three cells selected from the low-expression group versus the three pathways that were selected from each of the high-expression groups.

