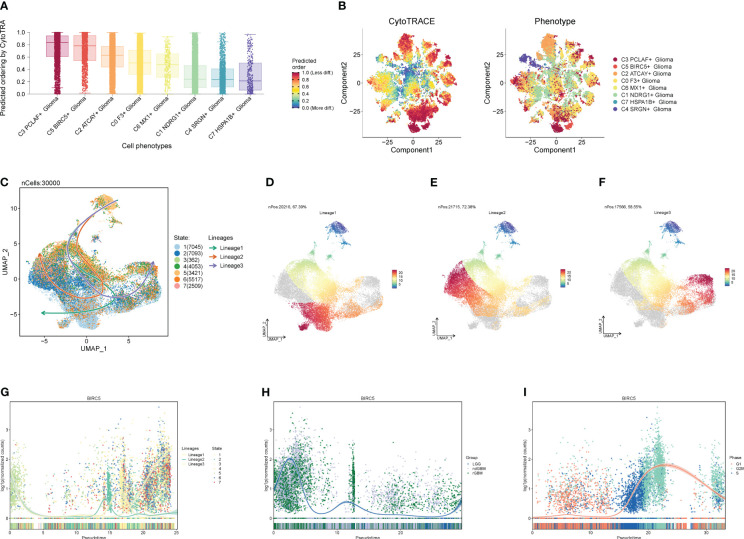
Figure 7.
Proposed chronological analysis of cell subpopulations. (A, B) Cytotrace scores of cell subpopulations. (C-F) Slingshot-based temporal trajectory maps of cell subpopulations with three trajectory differentiation directions. (G–I) Trajectory changes of marker gene BIRC5 with trajectory directions, clinical subtypes, and cellular staging.

