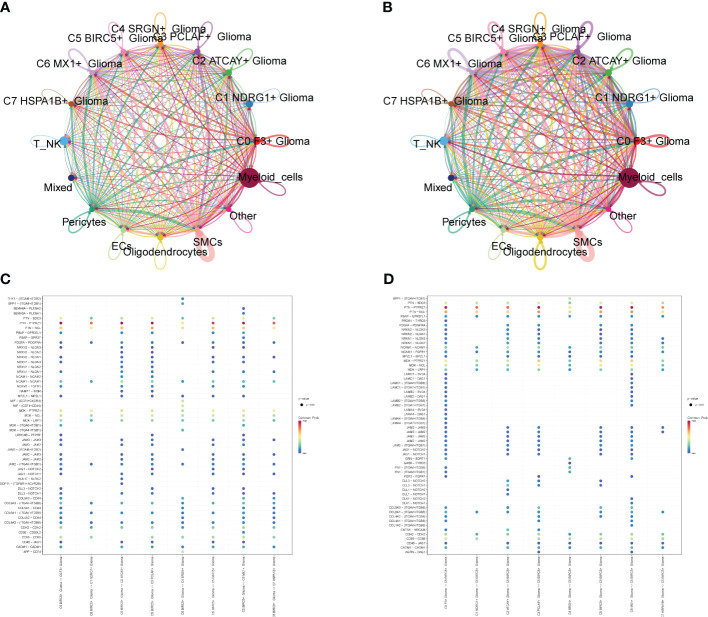
Figure 8.
Interaction analysis between cell subpopulations and large population cells. (A) Plot of the number of interactions between Glioma cell subpopulations and GBM large population cells; the thicker lines represent the higher number. (B) Plot of the intensity of interactions between Glioma cell subpopulations and GBM large population cells; the thicker lines represent the higher intensity. (C, D) Plot of points of the degree of interactions between C5 subpopulation and other cell subpopulations and large population cells with receptor ligands.

