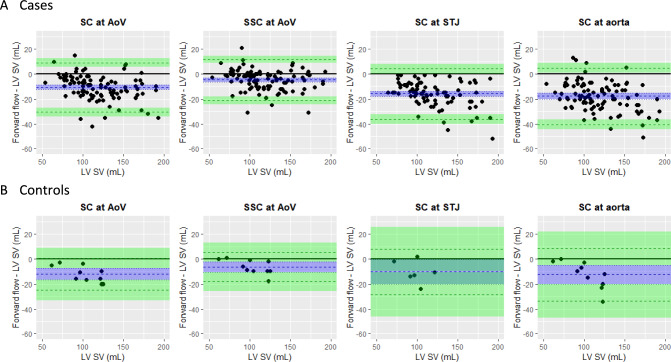
Fig. 5.
Bland Altman plots. Points above solid black like indicate patients with forward flow > LV SV, while points below the line indicate patients with forward flow < LV SV. Blue dashed line = mean difference between forward flow and LV SV across patients (i.e. bias of flow measurement). Blue shaded area = 95% CI for bias. Green dashed lines = limits of agreement between forward flow and LV SV. Green shaded areas = 95% CI for limits of agreement

