Fig. 5.
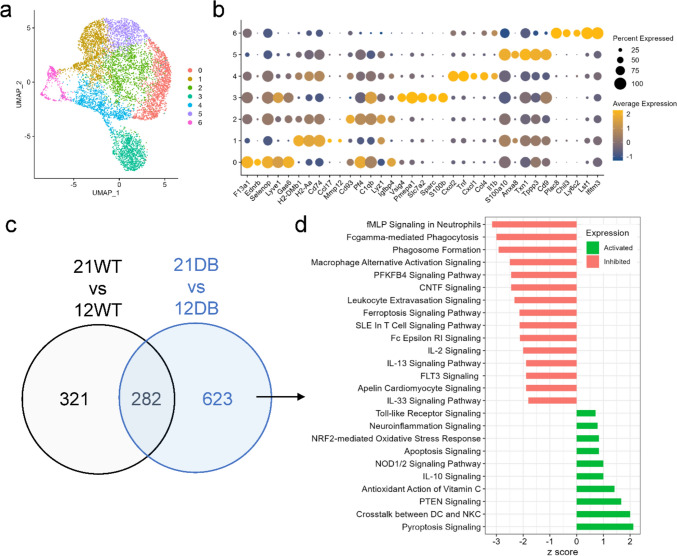
Macrophage sub-clustering analysis. a UMAP plot of all 7699 macrophages grouped into 7 sub-clusters. b Dot plot showing the top five gene markers from each cluster. c Venn diagram showing the overlap of differentially expressed genes from 21-week-WT vs 12-week-WT and 21-week-DB vs 12-week-DB macrophages. d The pathway analysis of 623 genes unique to DB showing the activated or inhibited pathways from the 21-week-DB as compared to 12-week-DB

