Fig. 6.
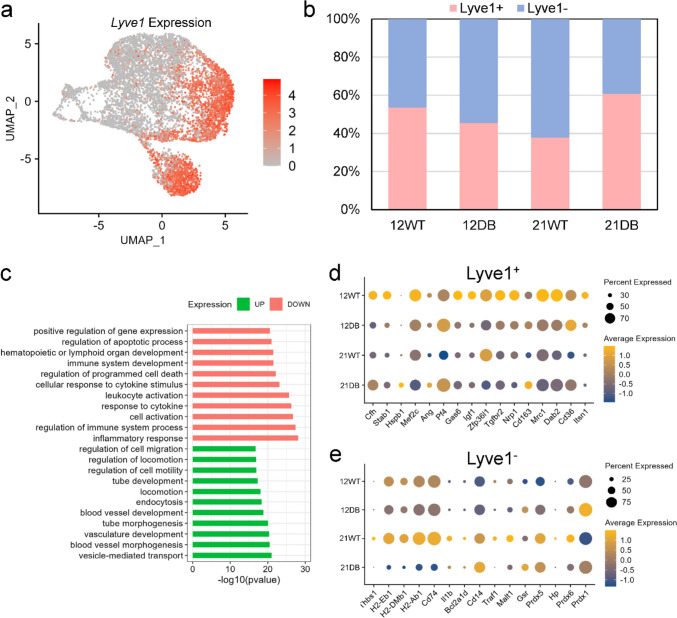
Analysis of Lyve1+ and Lyve1− macrophage sub-populations: a UMAP plot showing Lyve1 expression across macrophage sub-clusters. b Bar plot showing the relative proportion of Lyve1+ and Lyve1− cells across samples. c GO biological process enrichment analysis of upregulated and downregulated genes from Lyve1+ vs Lyve1− macrophages. d Dot plot showing the expression pattern of Lyve1+ and e Lyve1−-specific genes across the samples

